
Measuring animation smoothness
Dropped frames are the fundamental unit of animation jank, but not all dropped frames are created equal. A frame that misses its deadline while nothing visually changes on screen is invisible to the user. The Chrome team has been exploring how to capture this nuance, and the key insight is that developers need to distinguish between when frames are dropped and whether those drops matter visually.
The existing tools—requestAnimationFrame() polling, FPS counters, and main-thread task tracking—all paint an incomplete picture. For example, a heavy main-thread task can starve requestAnimationFrame() callbacks entirely, driving the measured FPS to zero. But if the compositor is still handling scrolling independently on its own thread, the page can remain visually smooth throughout. The user sees no jank, yet a naive FPS-based measurement would report a catastrophic failure.
The frame timing model
To reason about smoothness properly, you have to consider the full timeline of a frame, not just whether a paint happened. A frame begins with input or visual change, proceeds through the rendering pipeline stages—style, layout, paint, composite—and ends when the browser presents the completed frame to the display. The deadline is set by the display's refresh interval. At 60 Hz, that's roughly 16.67 ms per frame; at 120 Hz, roughly 8.33 ms.
When the pipeline misses that deadline, the display shows the previous frame again. This is a dropped frame. But the cause and visibility of the drop matter enormously:
- A drop caused by the main thread being busy with layout or JavaScript is a main-thread drop.
- A drop caused by the compositor being unable to finish its work in time is a compositor-thread drop.
- A perceivable drop is one where the user's eye expects motion and the screen doesn't deliver it.
These categories overlap only partially. A page can drop many main-thread frames without any visible consequence, as the scrolling example demonstrates. Conversely, compositor-side drops—from excessive layer count, GPU memory pressure, or overly complex paint work—directly affect what the user sees, even if the main thread is idle.
What the Chrome team is building
The Chrome team is working on two complementary fronts. First, lab tooling is getting better animation detection so developers can catch jank systematically in CI or performance budgets. Second, Chromium's rendering pipeline diagnostics are being improved to expose where frame budgets are actually exceeded, rather than forcing developers to infer this from indirect signals.
The goal is a measurement approach that considers rendered frames, not just scheduled frames. A frame that the compositor delivers to the screen counts even if the main thread had no update to offer. A frame that the main thread completes but the compositor fails to present on time counts as jank. This reframing aligns the metric with the user's actual experience of motion.
Practical guidance for lab tooling today
While these diagnostics mature, there are practical steps you can take in your own measurement setups to get closer to the truth of animation smoothness:
- Track frame timings at the compositor level where possible, either through browser tracing or through the
PerformanceObserverfor frame timing data when available. - Avoid relying solely on
requestAnimationFrame()polling to compute FPS. The technique has a long list of flaws: every script sets up its own loop, polling can block the critical path, and it prevents the browser from scheduling long idle blocks. - Look at frame timing histograms rather than averages. A single dropped frame every second is far less perceptible than a burst of drops in sequence, and averages will hide both patterns.
- Separate main-thread and compositor-thread measurements. If you only measure one, you will either report false positives (jank the user never sees, as in the scrolling example) or miss real jank (compositor drops from GPU pressure or layer explosion).
One meaningful interim metric is to measure which frames were presented versus which frames were scheduled. The gap between these two numbers is the real dropped-frame count. This can be approximated with the requestVideoFrameCallback() API for video elements and, for page animations, by listening for compositor-level notifications in headless or instrumented Chrome runs.
The complexity of the animation frame definition
The definition of an animation frame matters more than you might expect. A frame that repeats a static page is not an animation frame; it's just a refresh. The visual update is null. A drop during an animation, where motion should have occurred, is the only kind of drop that constitutes jank.
This subtlety is why the Chrome team distinguishes between:
- Frames with no visual update (which can be skipped or delayed freely).
- Frames with a visual update that misses its deadline (real jank).
- Frames with a visual update that arrives just in time but causes subsequent work to be late (cascading jank).
There is ongoing investigation into whether a metric like "animation smoothness" should be defined as the percentage of animation frames delivered on time, or as a weighted function that penalizes longer stretches of consecutive dropped frames more heavily—since humans perceive a burst of stutter as much worse than evenly spaced individual drops.
Another question being explored is how to attribute smoothness to the proper layer or element. A whole-page metric is too coarse to help developers debug a specific animation buried deep in a layout. Chrome's rendering diagnostics are improving toward surfacing the specific rendering object or paint layer responsible for a missed deadline, which will help pinpoint the offending CSS property or compositor layer.
For now, the recommendations stand: debug animation jank with Chrome DevTools' performance traces to identify the offending stage in the pipeline, and always test on the target device class you expect your users to have. Lab tests on a high-end desktop will rarely expose the compositor or GPU strain that budget phones routinely hit.
Why frame counts miss the point
Animation frame updates are not a simple pass/fail. A frame can be only partially presented: the browser may fail to produce a new main thread update within the frame deadline, yet still deliver a compositor thread update (for example, during threaded scrolling). In that case, some stale content and some new visual updates reach the screen simultaneously.
This is why declarative animations of composite properties are recommended: the compositor can drive them entirely, even when the main thread is busy, producing updates efficiently and in parallel. Conversely, a main thread update that arrives after missing several frame deadlines gives the browser some new content, but not the latest. These situations, where not all new visual updates are present, are partial frames — and they are fairly common. Ideally, partial updates include the most important visual updates, like animations, but that requires animations to be compositor-driven.
Another source of partial updates is media that hasn't finished decoding and rasterizing in time, or content that falls behind during rapid scrolling. Pixel renditions outside the viewport may be discarded to save GPU memory, and re-rendering after a large fling can take longer than one frame — a phenomenon known as checkerboarding.
Each frame rendering opportunity lets you track how much of the latest visual state actually reaches the screen. Measuring this over time is frame throughput. When the GPU is overloaded, the browser or platform may throttle the attempt rate, reducing effective frame rates. That technically lowers dropped-frame counts, but visually appears as reduced throughput anyway.
Not all low throughput is problematic. A mostly idle page with no active animations looks just as good at a low frame rate, and saves battery. The question becomes: when does frame throughput actually matter?
What counts as an animation update
High frame throughput matters during periods with important animations. Different animation types depend on updates from specific threads — main, compositor, or worker — and a thread affects smoothness whenever an active animation depends on its update arriving on time.
Detecting animations is not trivial. Declarative animations and user-input-driven animations are clearly defined, but JavaScript-driven animations that periodically mutate style properties are harder to detect. Even requestAnimationFrame() doesn't guarantee a visual update: using rAF to poll frame rate, for example, shouldn't affect smoothness measurements because no visual state changes.
Quantity versus quality
Both of those dimensions — whether a frame was dropped and whether an active animation existed — describe the quantity of updates, not their quality. A video at a steady 60 fps may still show low bitrate artifacts or network buffering. A canvas game might hit perfect frame timing while failing to load high-quality assets or exhibiting rendering glitches. Distinct from frame timing, these issues can be equally jarring to users.

A score for each frame state
Because frames can be partial or dropped without affecting perceived smoothness, the working model treats each frame as having a completeness — or smoothness — score. Ordered from best to worst, the states of a single animation frame are:
| No Update Desired | Idle time, repeat of the previous frame. |
| Fully presented | The main thread update was either committed within deadline, or no main thread update was desired. |
| Partially presented | Compositor only; the delayed main thread update had no visual change. |
| Partially presented | Compositor only; the main thread had a visual update, but that update did not include an animation that affects smoothness. |
| Partially presented | Compositor only; the main thread had a visual update that affects smoothness, but a previously stale frame arrived and was used instead. |
| Partially presented | Compositor only; without the desired main update, and the compositor update has an animation that affects smoothness. |
| Partially presented | Compositor only but the compositor update does not have an animation that affects smoothness. |
| Dropped frame | No update. There was no compositor update desired, and main was delayed. |
| Dropped frame | A compositor update was desired, but it was delayed. |
| Stale frame | An update was desired, it was produced by the renderer, but the GPU still did not present it before the vsync deadline. |
Those states can be collapsed into a score, which can reasonably be interpreted as the probability that the state is visible to a user. One dropped frame may not register, but a sequence of dropped frames that affect smoothness certainly will.
A Percent Dropped Frames approach
For an at-a-glance appraisal, deep-diving frame state is overkill. Since frames are often partially presented, and since fully skipped updates may not affect smoothness, the focus shifts from raw dropped-frame counts to the extent to which the browser fails to provide visually complete updates when it matters. The mental model moves:
- From frames per second,
- To detecting missing and important updates,
- To percentage dropped over a given time window.
The core signal is the proportion of time spent waiting for important updates, which aligns with how users actually experience smoothness. The metrics in use are:
- Average Percent Dropped: across all non-idle animation frames in the timeline.
- Worst Case of Percent Dropped Frames: over 1-second sliding windows.
- 95th percentile of Percent Dropped Frames: over 1-second sliding windows.
These are exposed in some Chrome developer tools today. Frame latency and other factors are under consideration as well.
Where to find these measurements
Performance HUD
Chromium's Performance HUD, enabled via chrome://flags/#show-performance-metrics-hud, shows live Core Web Vitals alongside experimental animation smoothness scores based on Percent Dropped Frames.
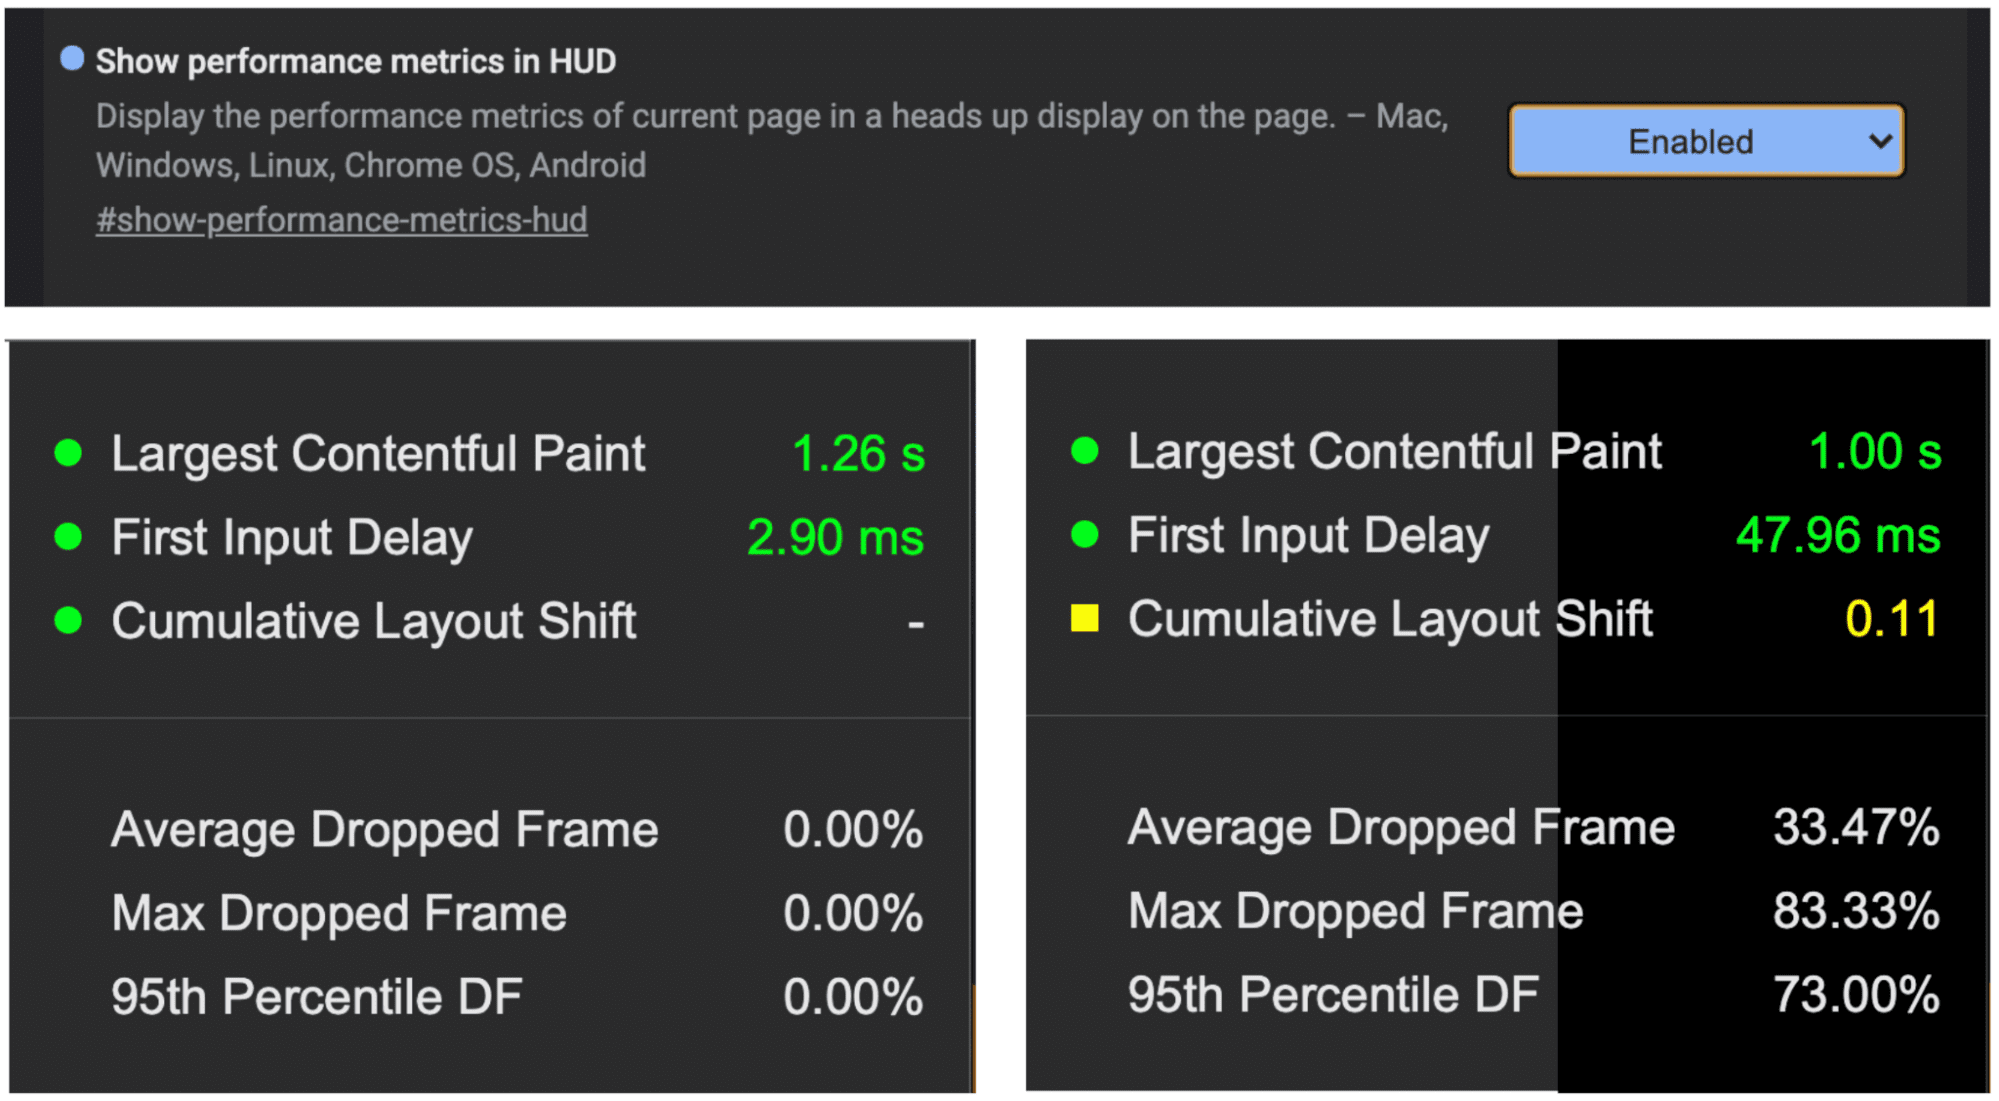
Frame Rendering Stats
The DevTools "Frame Rendering Stats" rendering setting provides a live view of animation frames. Color coding distinguishes partial updates from fully dropped frames, and the reported fps reflects only fully presented frames.

Frames viewer in Performance profiles
The DevTools Performance panel's Frames viewer previously drifted out of sync with the modern rendering pipeline, but recent improvements in Chrome Canary align frames with vsync boundaries and color-code status. Full visualization of the nuanced states above is still planned.

Chrome tracing
For detailed analysis, the Perfetto UI (or about:tracing) captures a "Web content rendering" trace. Several additions make Chrome's graphics pipeline more navigable, with an overview in the Life of a Frame document. Trace events can determine:
- Running animations via
TrackerValidationevents. - Exact animation frame timelines via
PipelineReporterevents. - For janky updates, the exact blockers within
PipelineReporterevent breakdowns. - For input-driven animations, latency to visual update via
EventLatencyevents.

Toward a standard metric
The Web Vitals effort aims for lab-based metrics parallel to Total Blocking Time (TBT). A lab-based animation smoothness metric with similar characteristics is in design. The longer-term goal is to expose APIs for measuring smoothness in the field across real users. Feedback on these directions is welcome via the web-vitals-feedback Google group with "[Smoothness Metrics]" in the subject line.


