Searching and locating nodes in the DOM panel
Deeply nested DOM trees are hard to navigate by eye. In every major browser you can search the tree with Cmd + F on macOS or Ctrl + F on Windows. The search field also accepts a valid CSS selector such as .red or an XPath expression such as //div/h1.

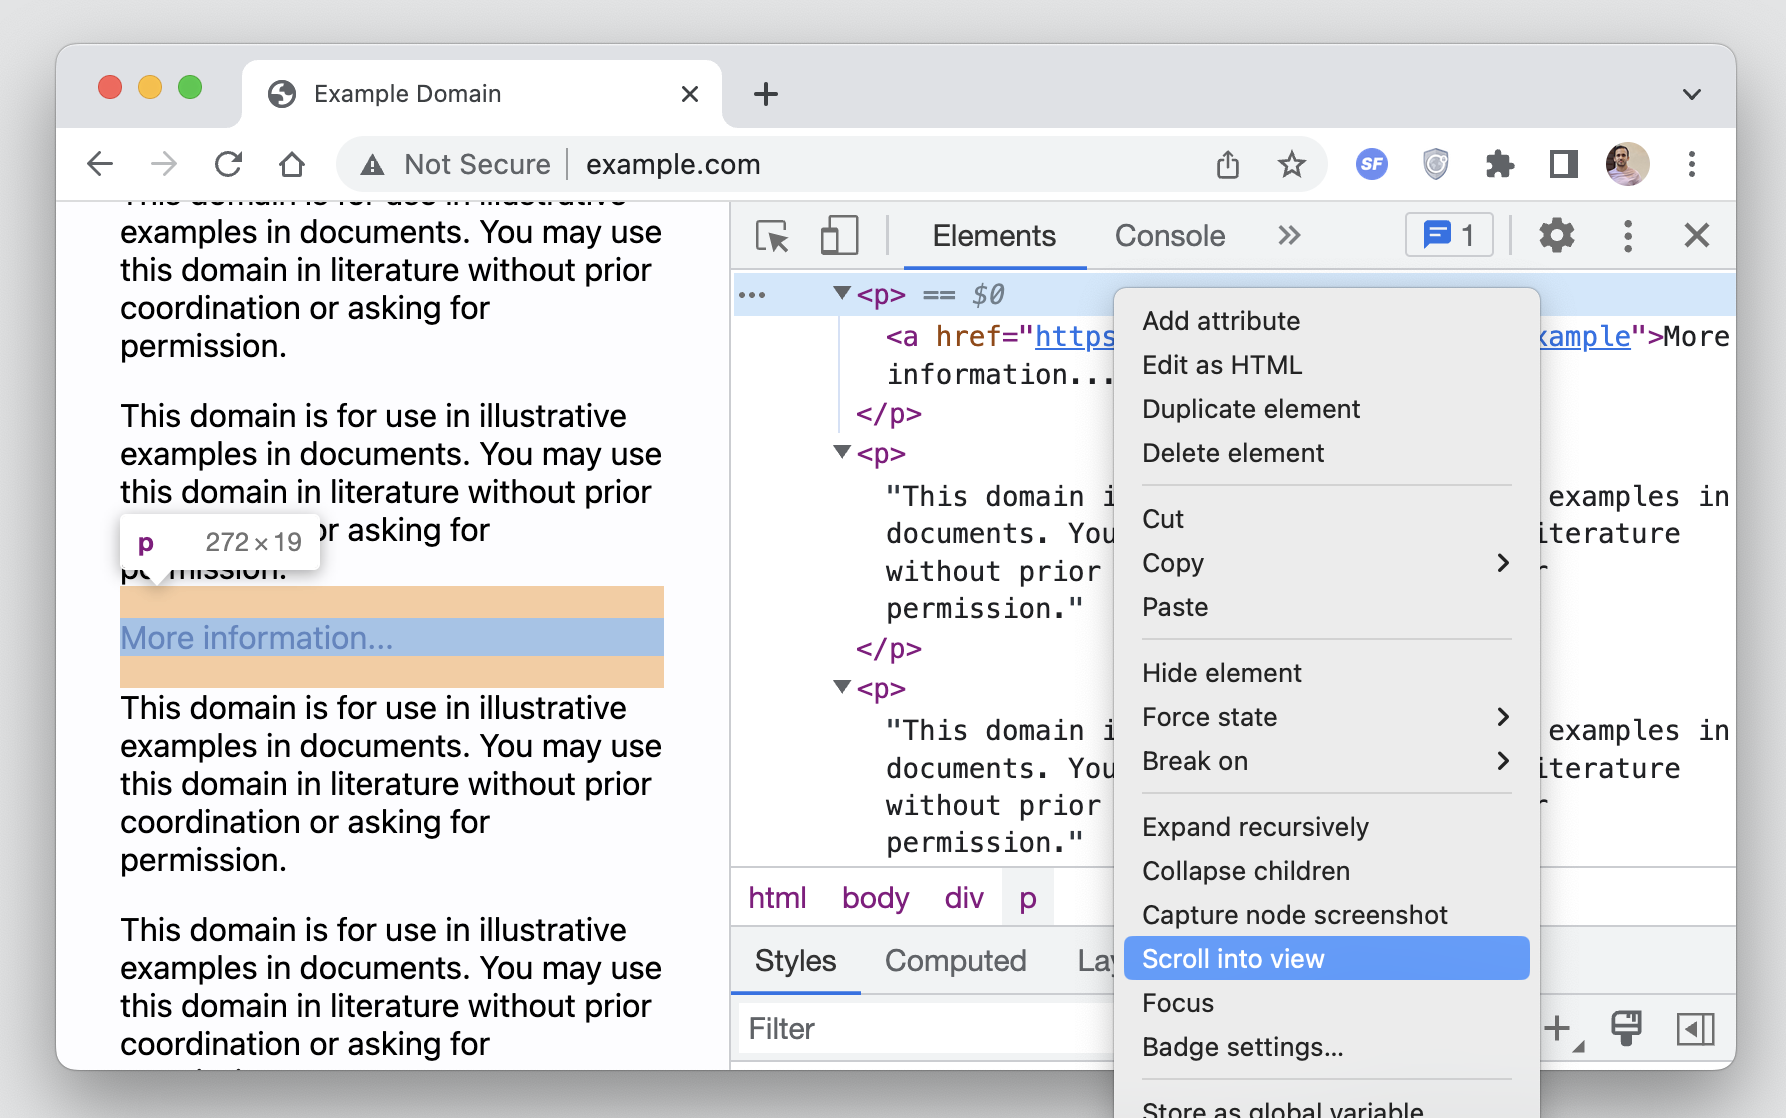
Chromium-family browsers — Chrome, Edge, Opera — move focus to the matching node while you type. That gets noisy with long queries or large trees, and can be turned off under Settings (F1) → Preferences → Global → Search as you type → Disable. Once a node is found, right-click it and choose “Scroll into view” to bring it into the viewport.
Reaching DOM nodes from the console
The console exposes several routes to a node. $0 refers to the node currently selected in the DOM tree; Chromium additionally keeps the selection history, so $1, $2, $3 and so on walk backwards through earlier selections.

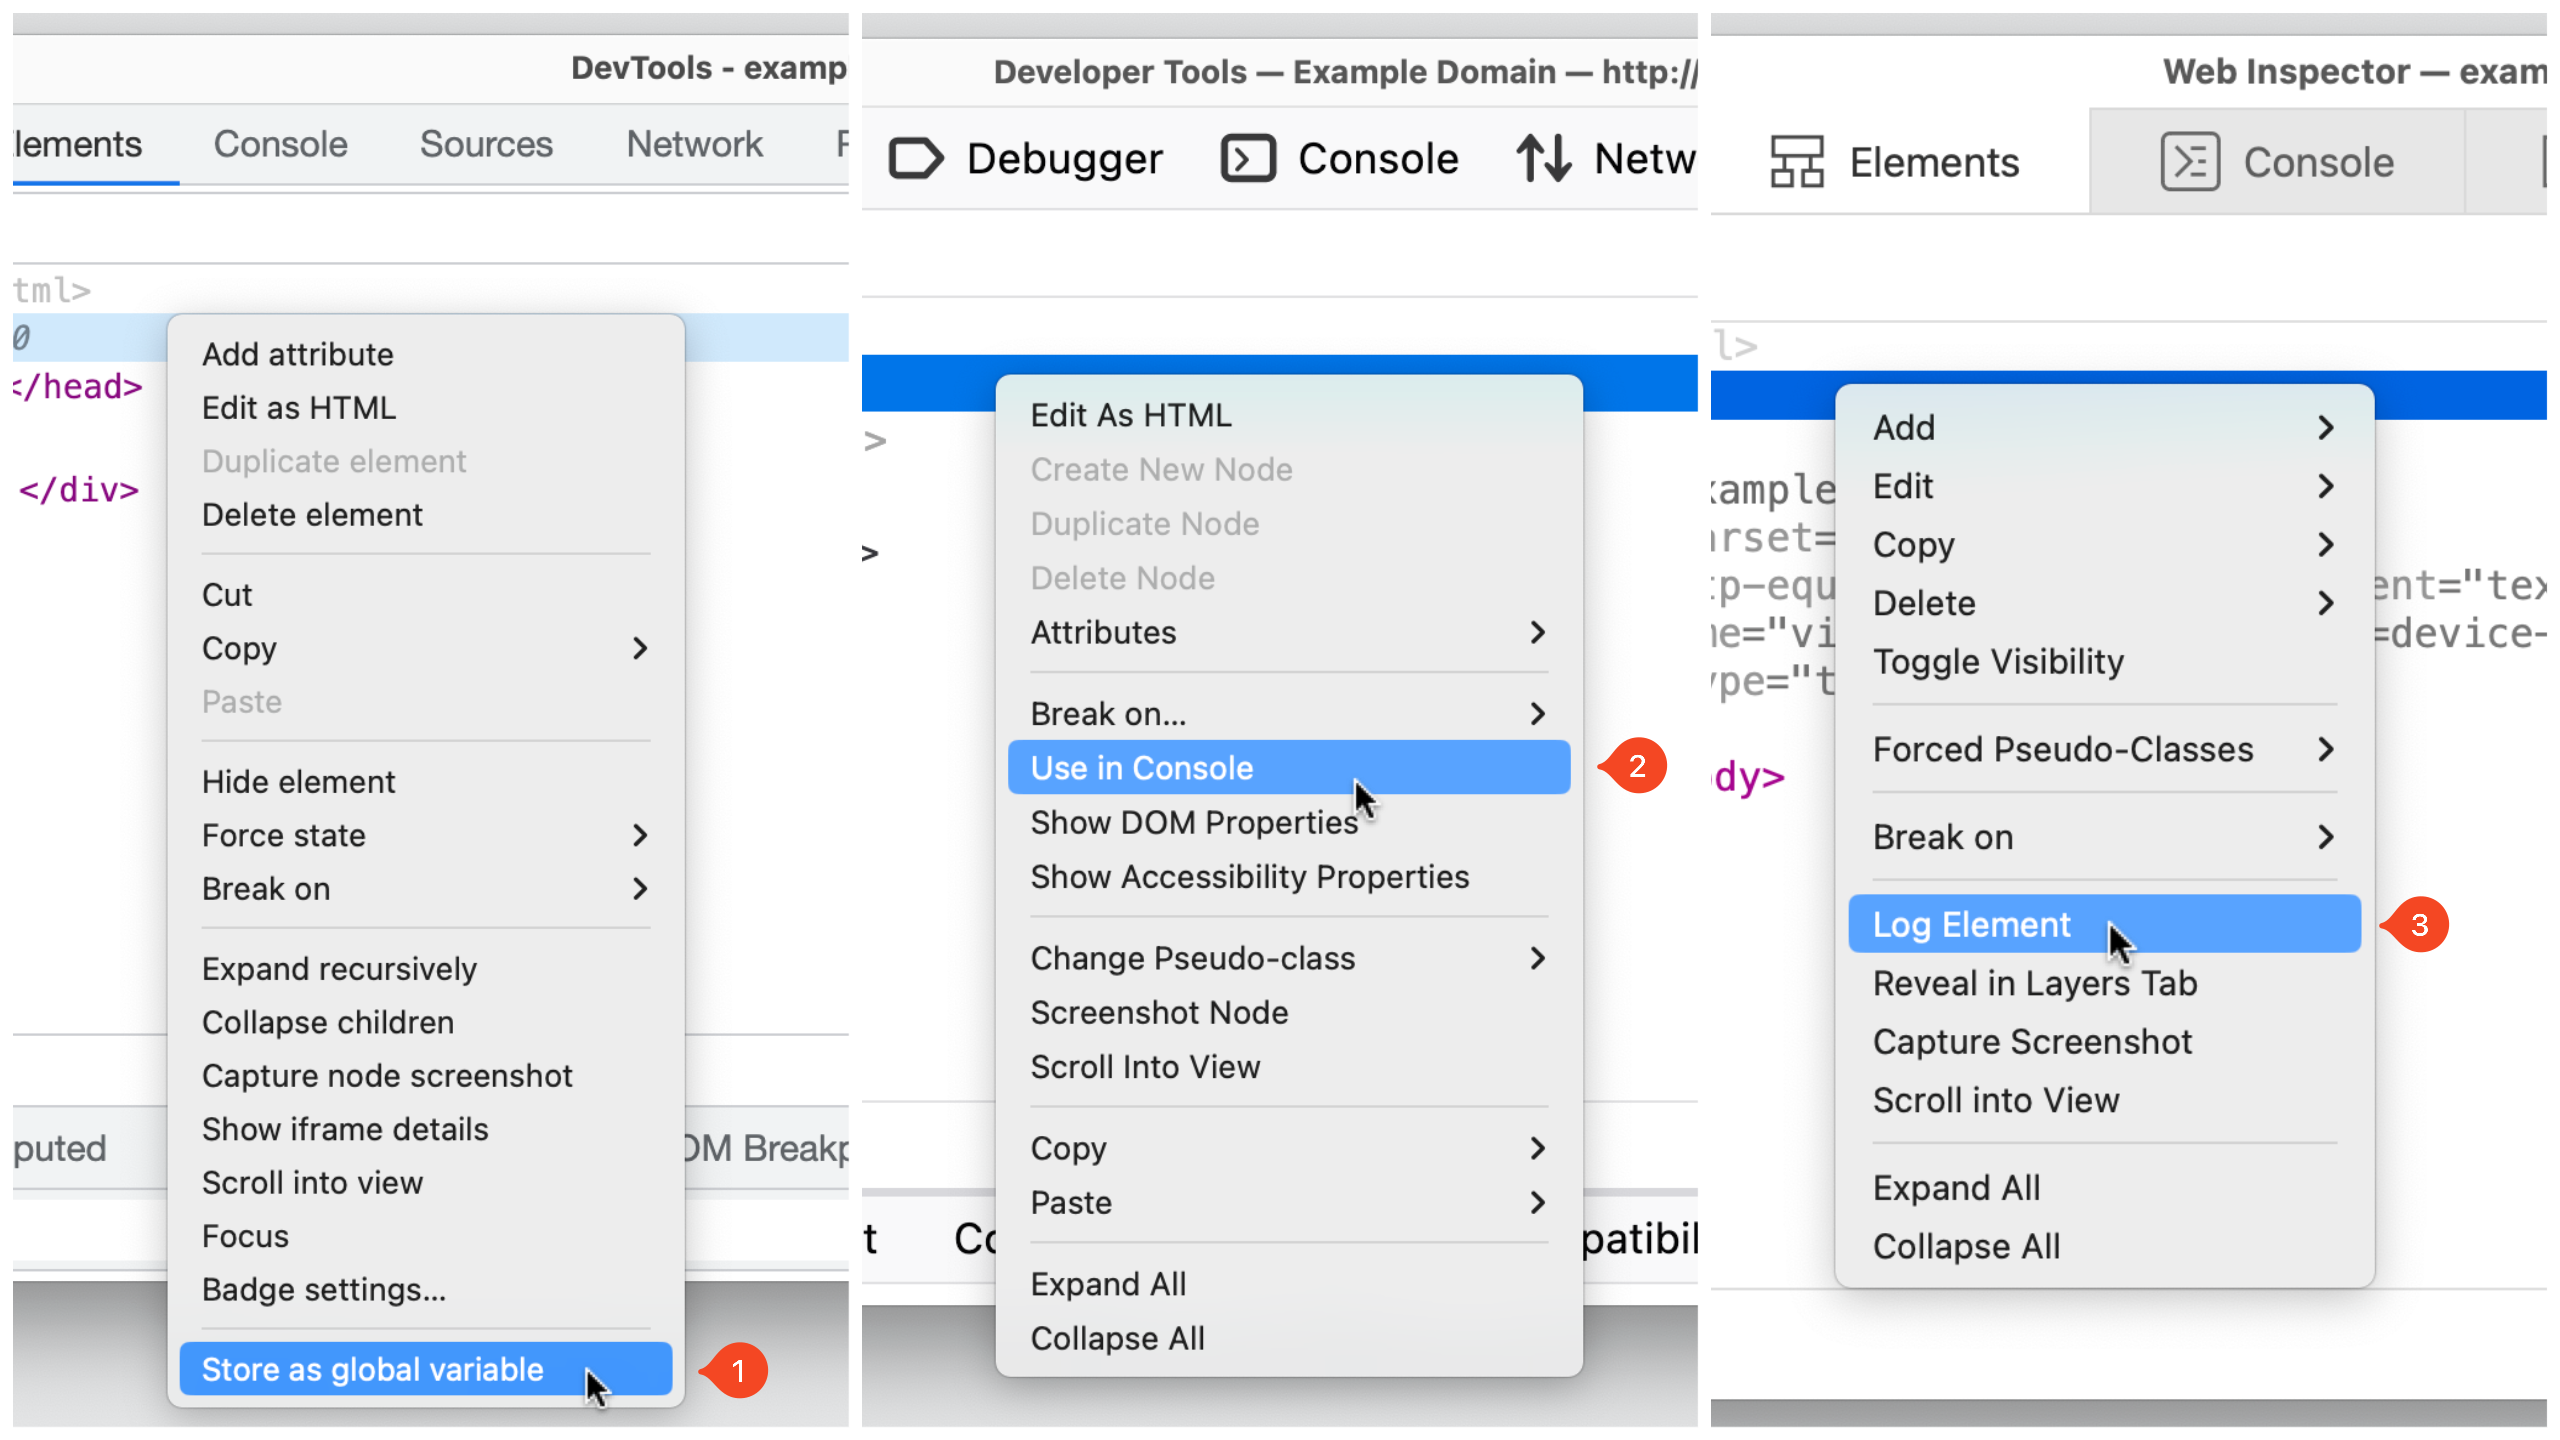
Chromium can also generate a document.querySelector expression for any node: right-click it and pick Copy → Copy JS path. Alternatively, right-click and store the node as a temporary variable. The menu label differs per browser:
- Chromium: “Store as global variable”
- Firefox: “Use in Console”
- Safari: “Log Element”
Element badges
Badges are small, clickable markers shown beside a node when it matches certain conditions. Each browser exposes a different set.
Safari puts a badge toggle button in the Elements panel toolbar. A node with display: grid or display: inline-grid gets a grid badge; clicking it overlays grid areas, track sizes, line numbers and more on the page.

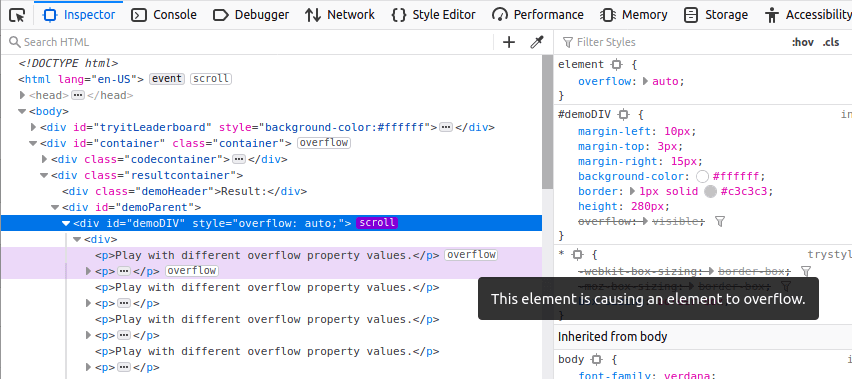
Firefox documents its supported badges in the source docs. A scroll badge, for example, flags a scrollable element, and clicking it highlights the element responsible for the overflow with an overflow badge beside it.
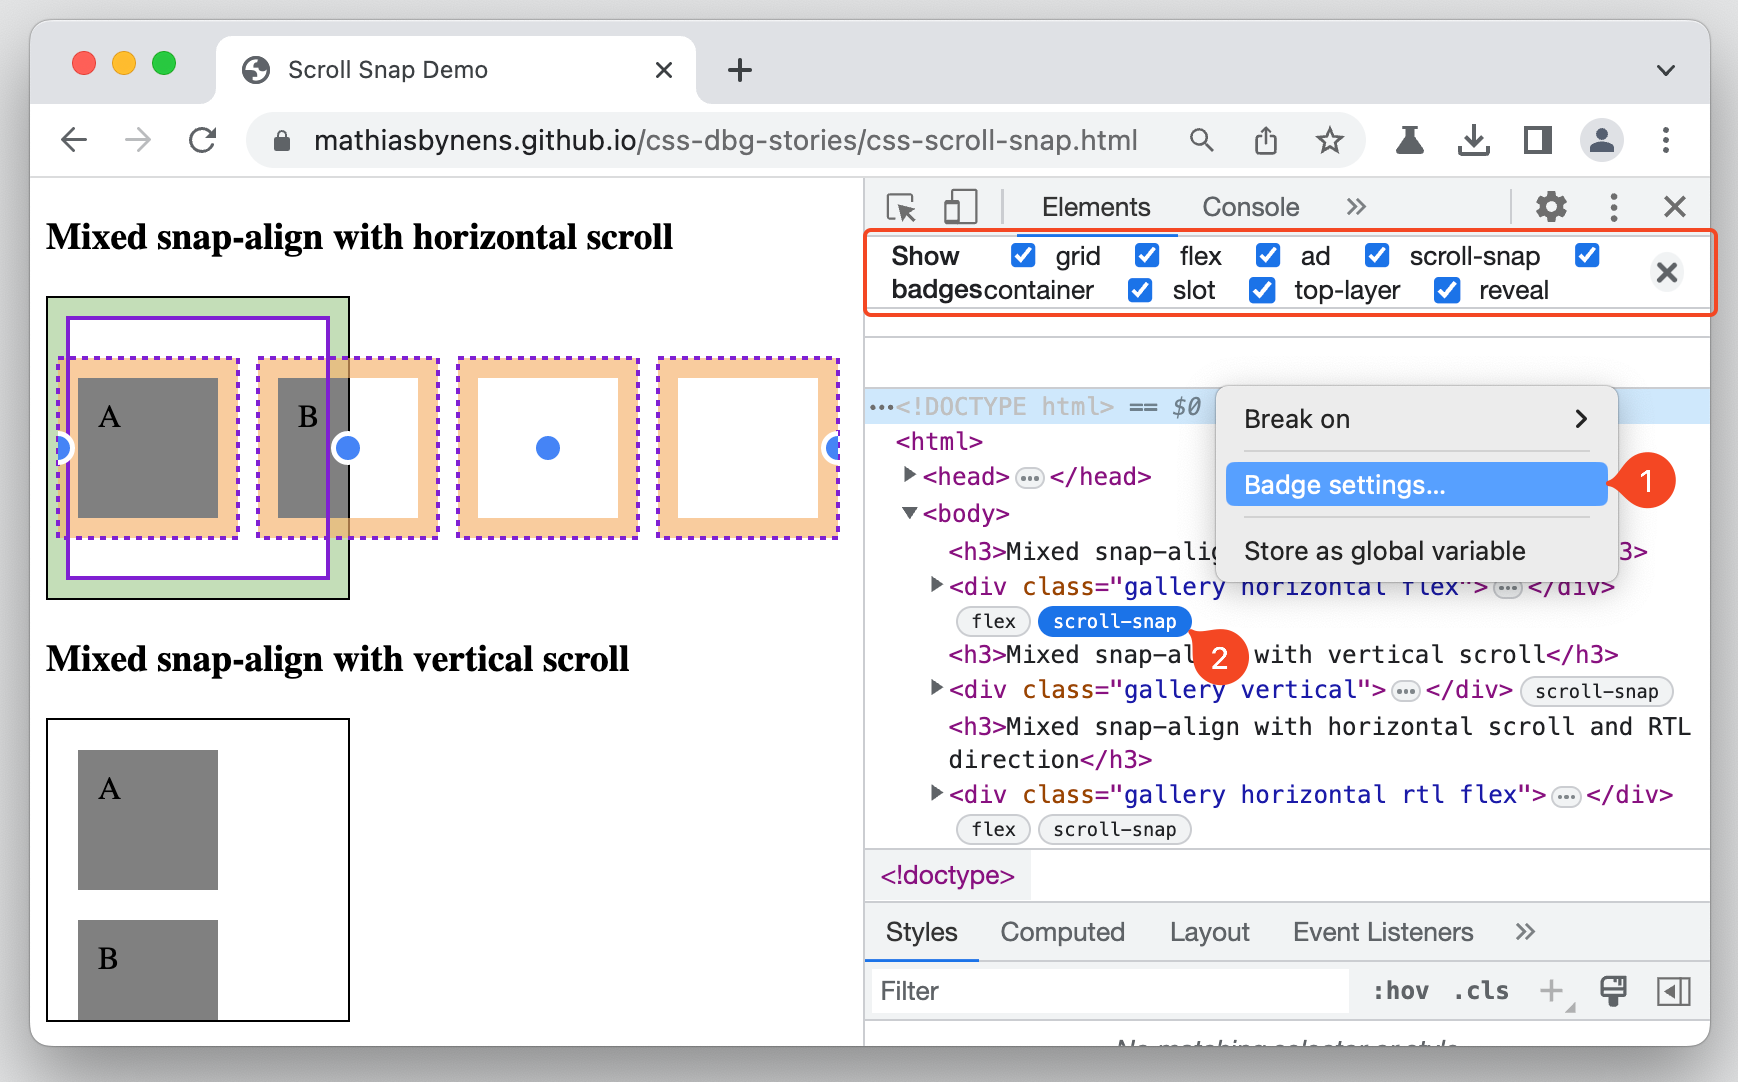
In Chromium, right-click any node and choose “Badge settings…” for a list of all available badges. An element with scroll-snap-type, for instance, carries a scroll-snap badge that toggles the corresponding overlay for that element.
Capturing screenshots
Screenshot capture is now present in all three toolchains. Right-click the DOM node you want and pick the capture option — its wording varies by browser.
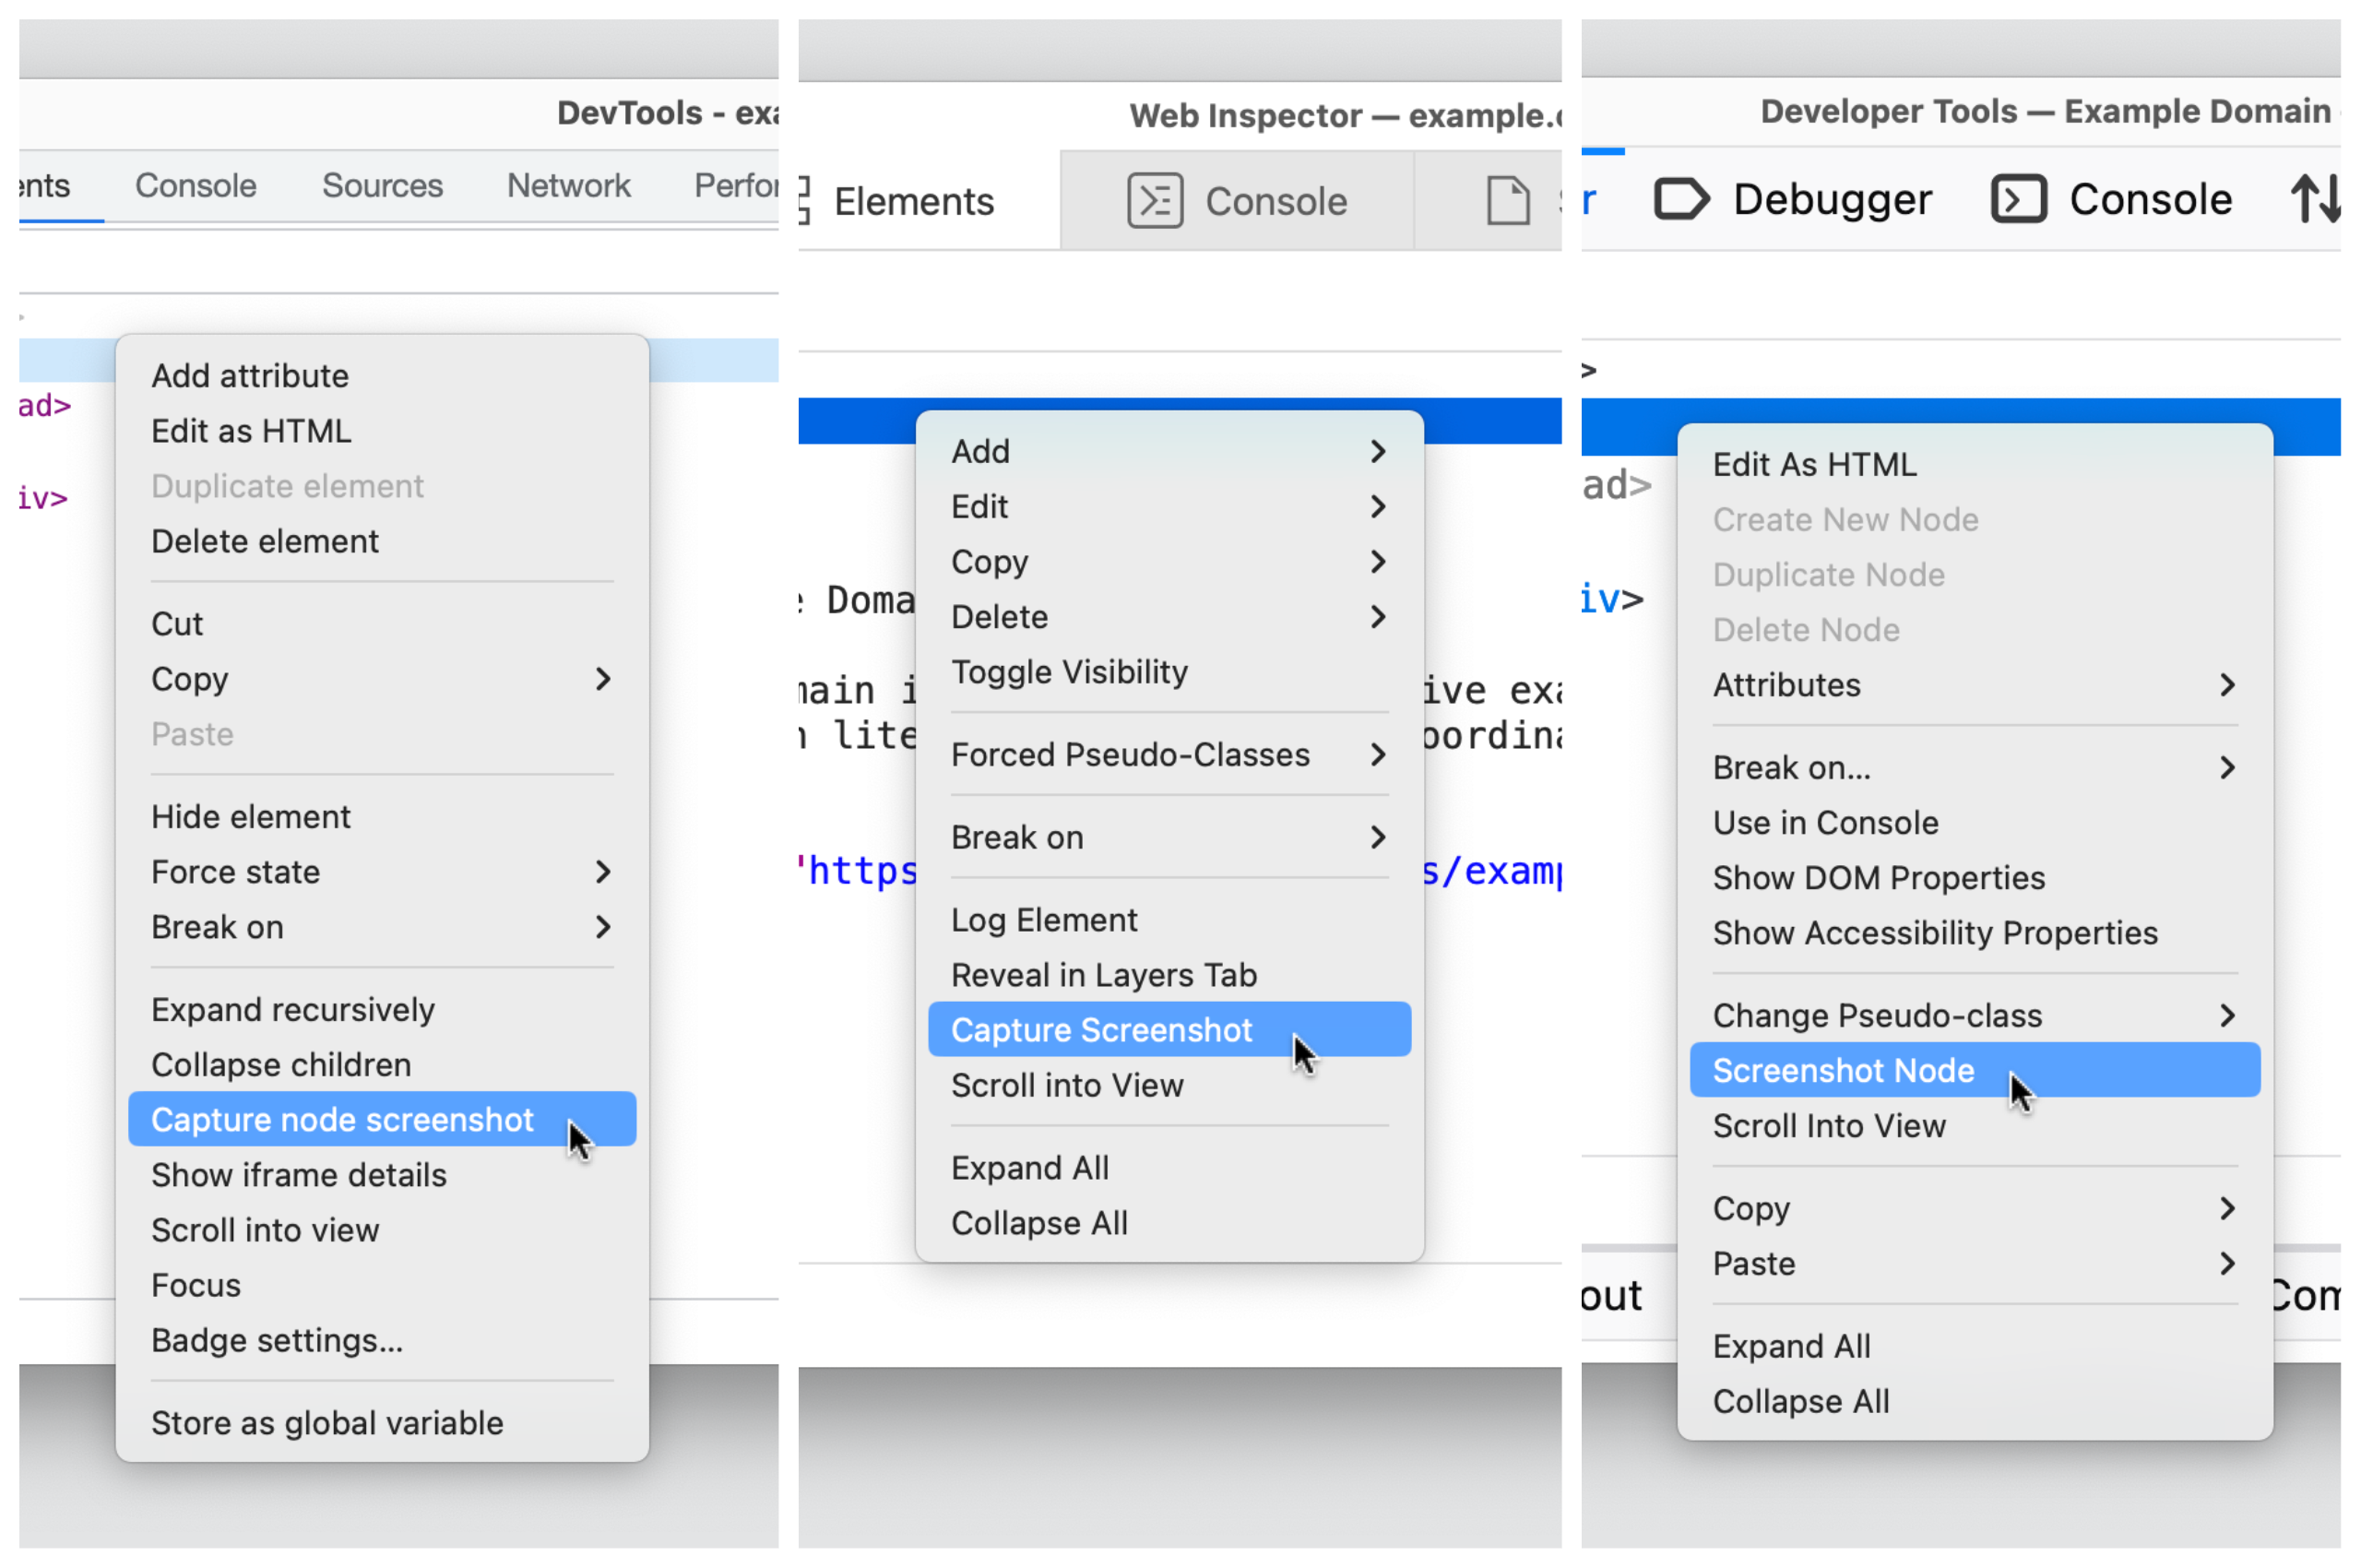
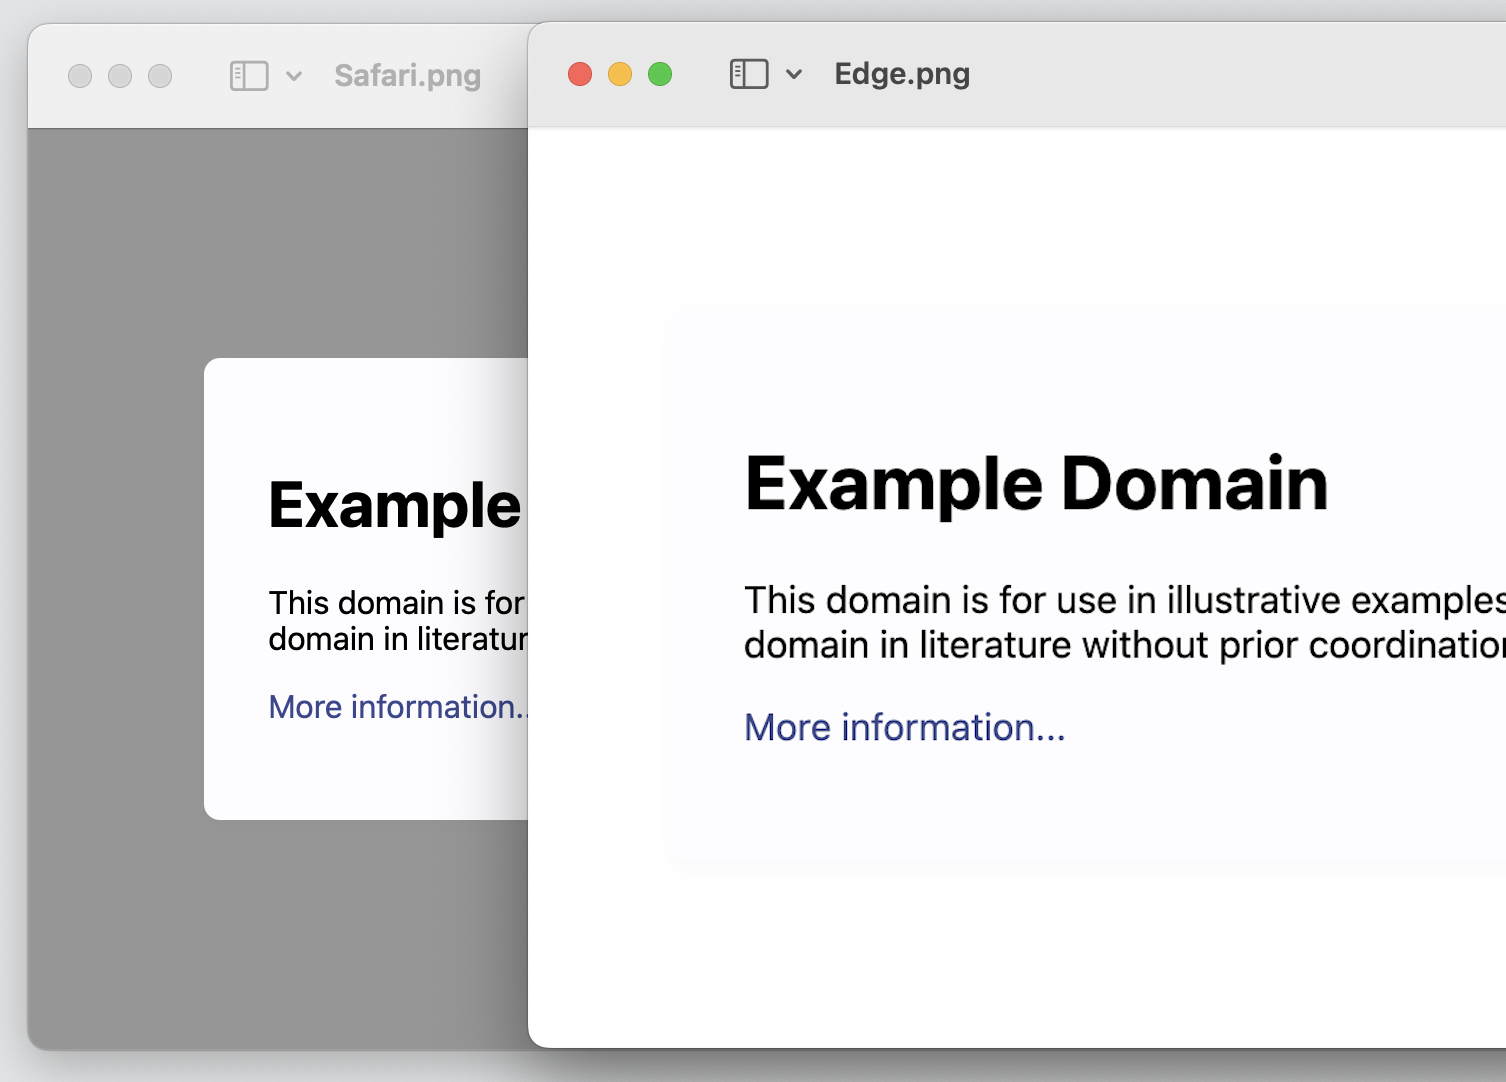
Running the same command on the html node produces a full-page shot. One difference: Safari keeps the background color's transparency, while Chromium and Firefox render it as white.
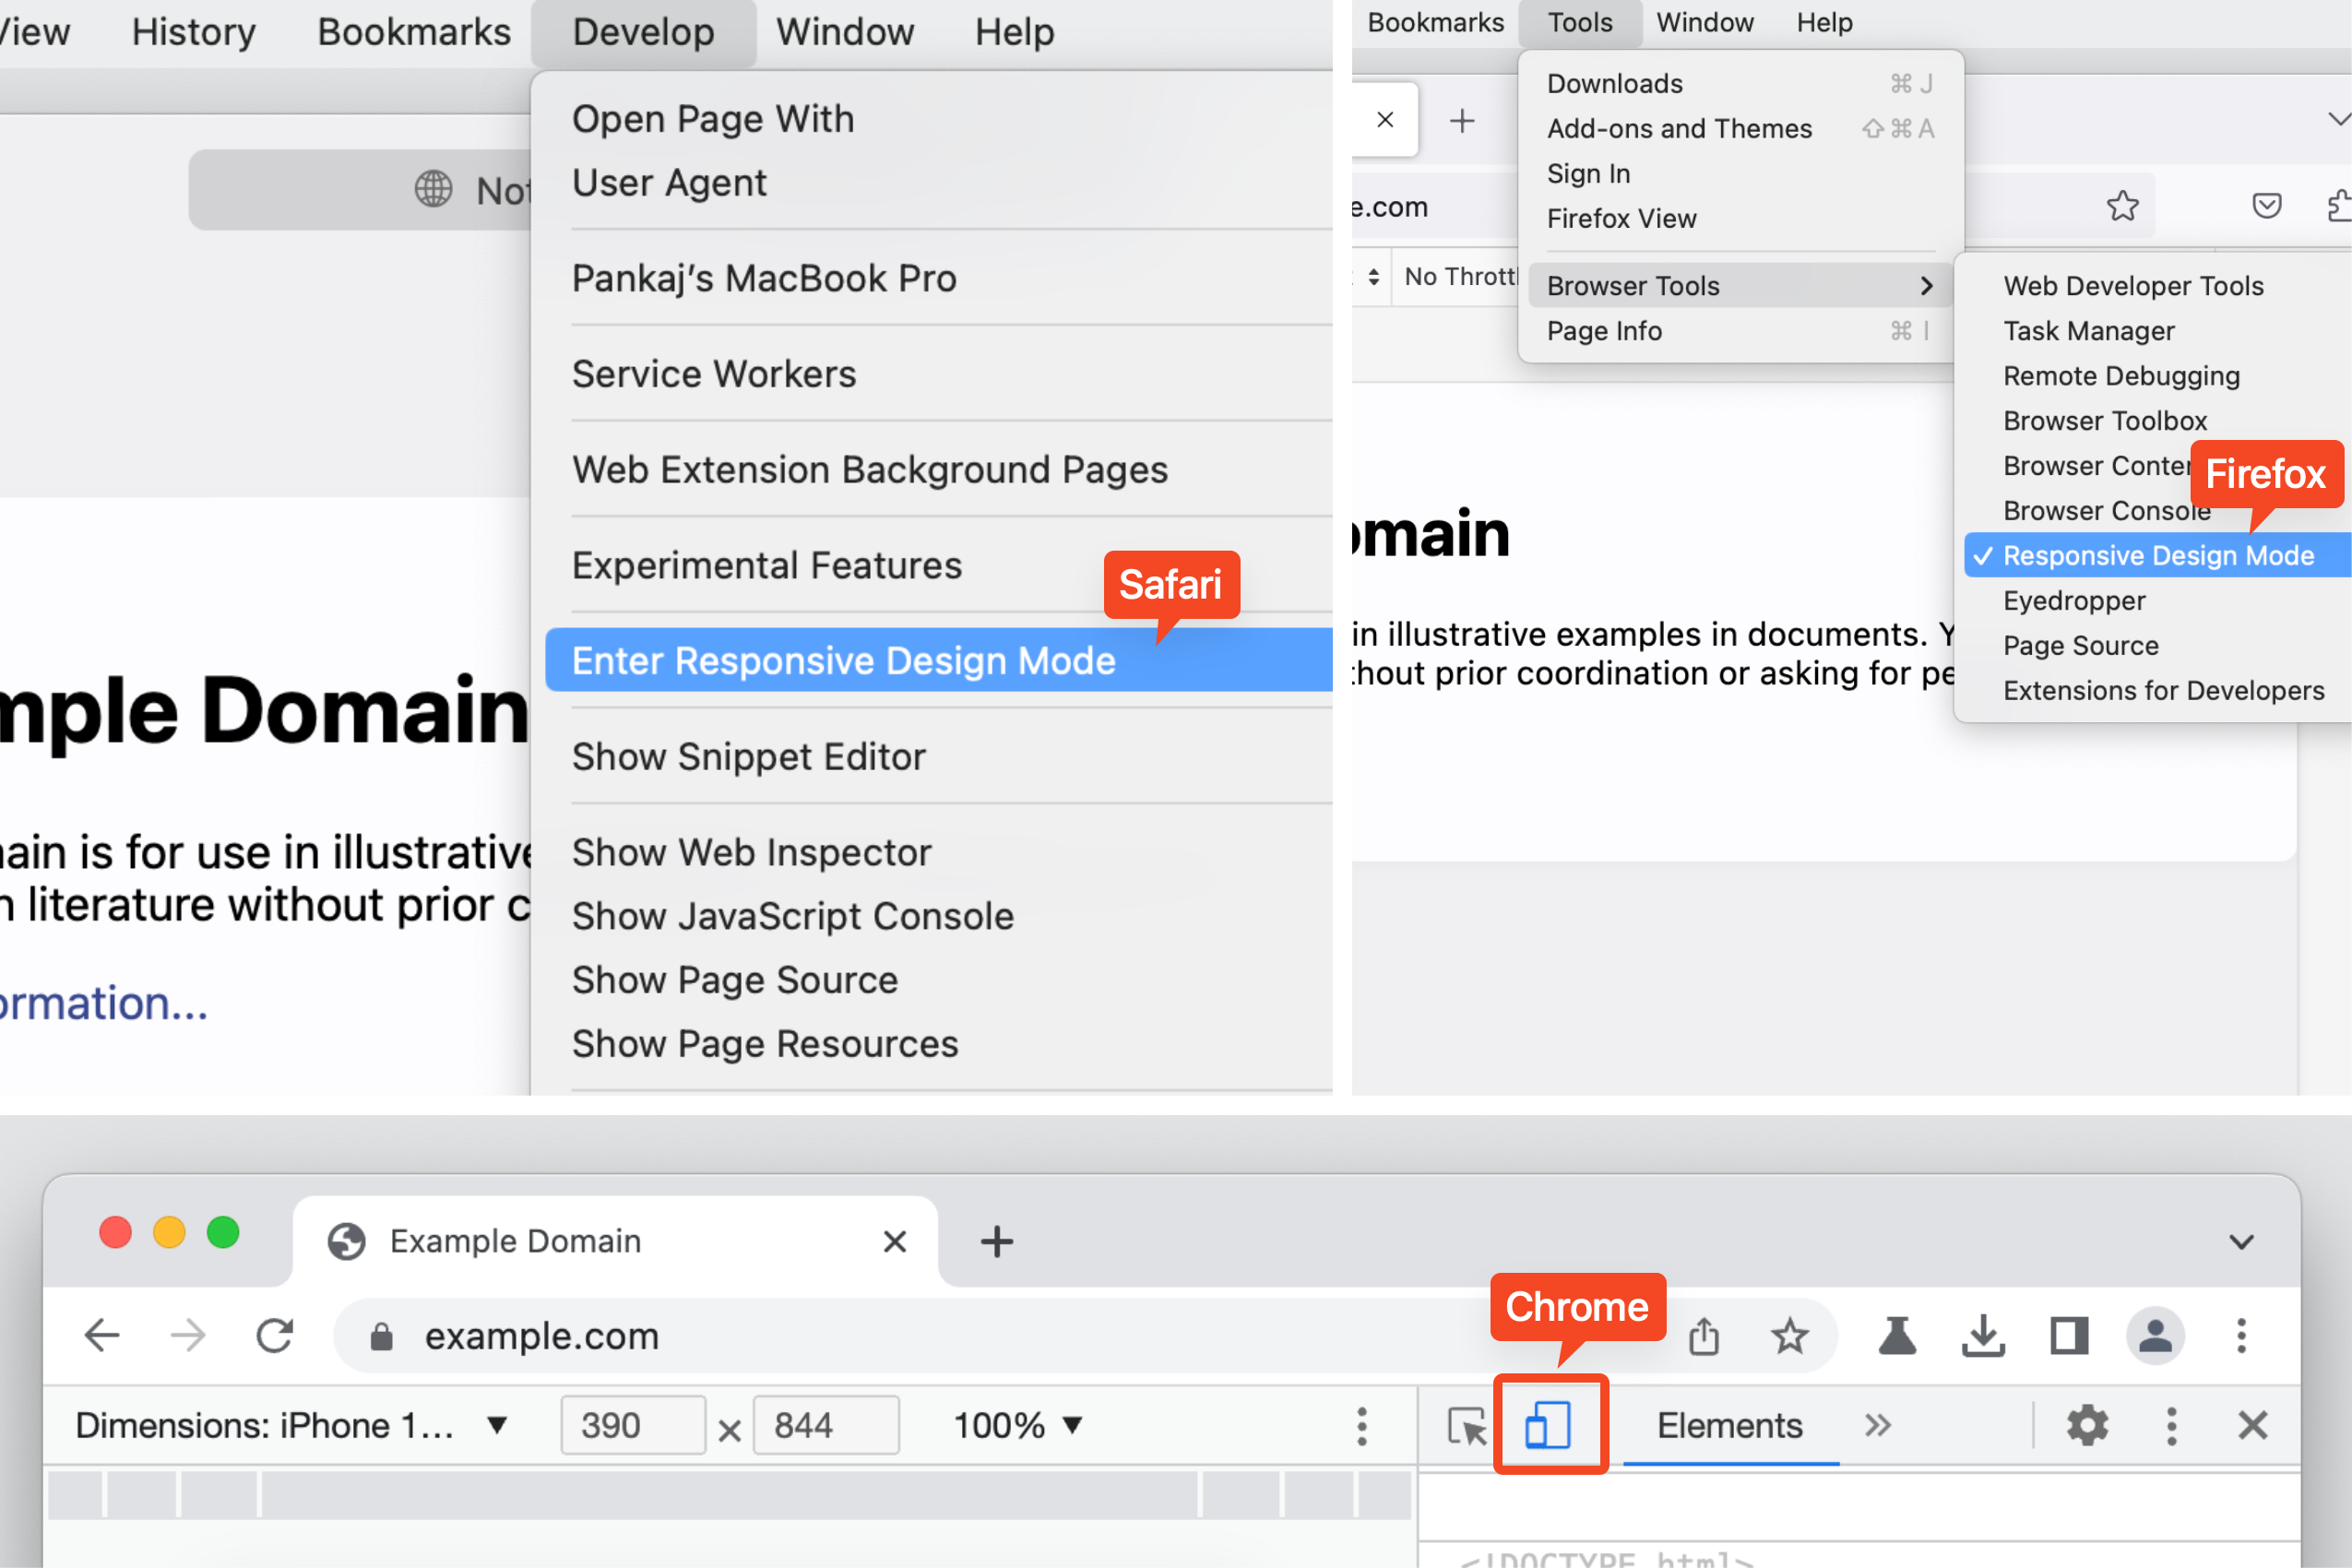
You can also capture at a specific viewport width via responsive mode:
- Chromium:
Cmd+Shift+M(macOS) orCtrl+Shift+M(Windows), or the “Devices” icon beside “Inspect”. - Firefox: Tools → Browser Tools → “Responsive Design Mode”.
- Safari: Develop → “Enter Responsive Design Mode”.
Browser-specific shortcuts worth knowing
Chrome: inspecting the top layer
Chrome can visualize and inspect top-layer elements such as dialogs, alerts and modals. Anything added to the #top-layer gets a top-layer badge; clicking it jumps to the top-layer container placed just after the </html> tag. Entries are ordered by stacking order, so the last one sits on top. The reveal badge takes you back to the original node.
Firefox: jumping to an ID target
Firefox underlines the element that references an ID attribute, linking it to its target in the same DOM. CMD + Click (macOS) or CTRL + Click (Windows) jumps straight to the element carrying that identifier.