
Hunting down slow third-party scripts
Third-party scripts are often outside your direct control, but that doesn't mean you're powerless when they drag down performance. The first step is figuring out which resources are actually causing the damage. Lighthouse and Chrome DevTools provide a layered approach to that detective work, from quick audits to targeted network blocking experiments.
Quick wins with Lighthouse
The Lighthouse Performance audit is the fastest way to surface problematic third-party code. Slow scripts typically show up under the Diagnostics section, specifically in the Reduce JavaScript execution time and Avoid enormous network payloads audits.
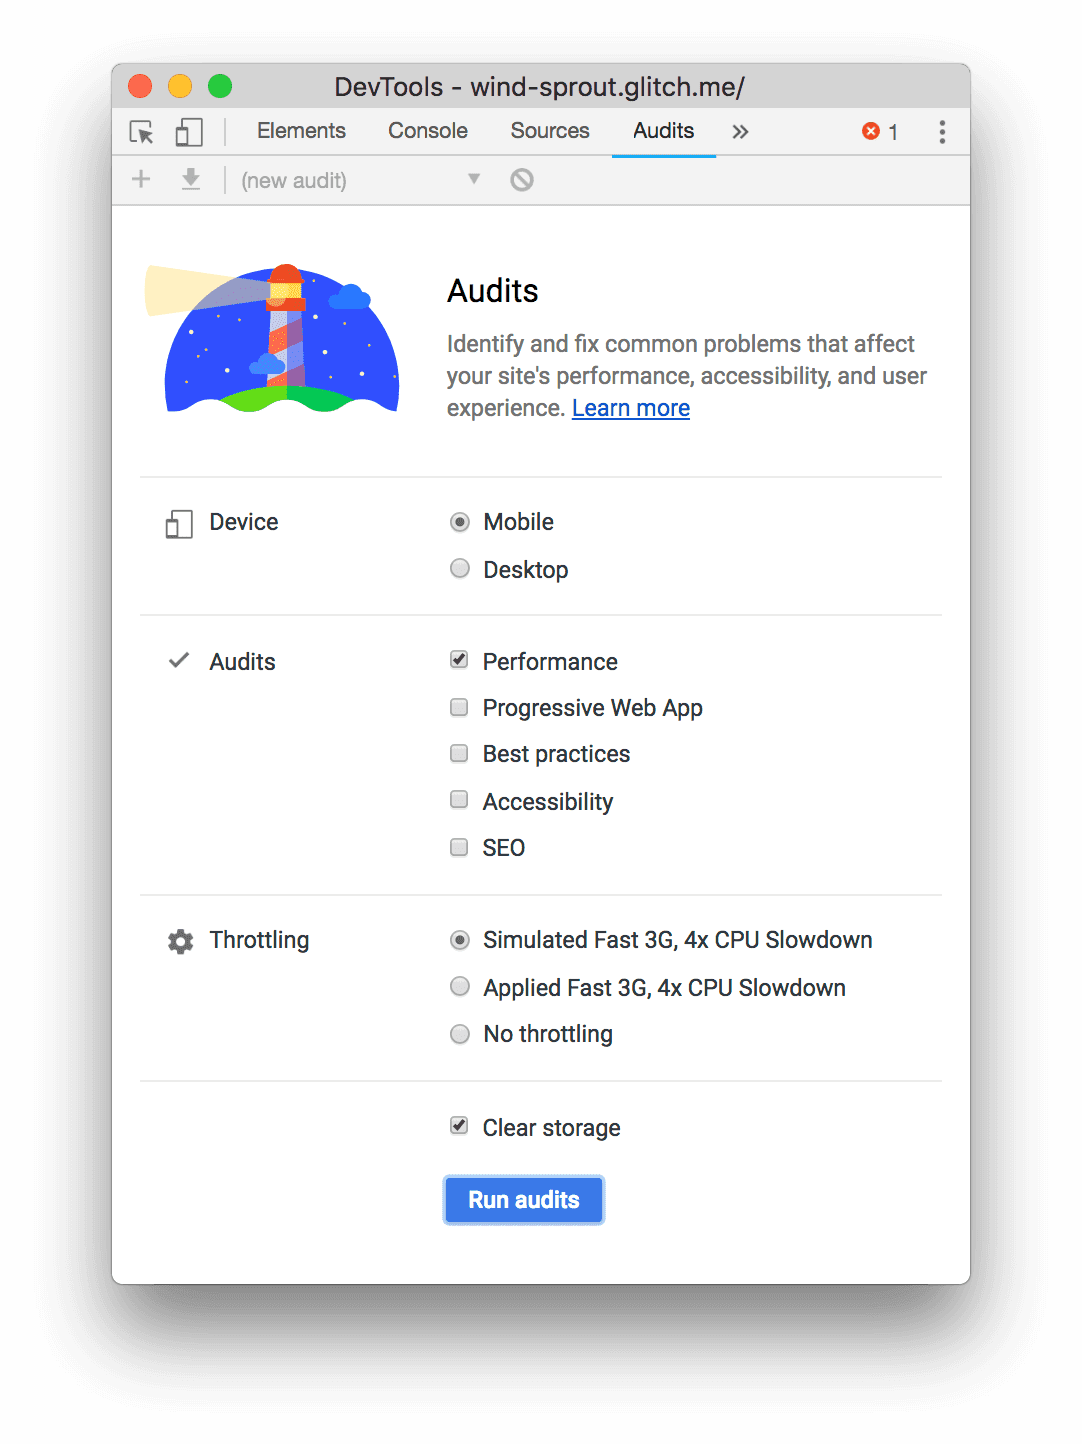
Run the audit directly from DevTools:
- Press
Control+Shift+J(orCommand+Option+Jon Mac) to open DevTools. - Click the Lighthouse tab.
- Click Mobile.
- Select the Performance checkbox. (You can clear the rest of the checkboxes in the Audits section.)
- Click Simulated Fast 3G, 4x CPU Slowdown.
- Select the Clear Storage checkbox.
- Click Run audits.
Check third-party usage
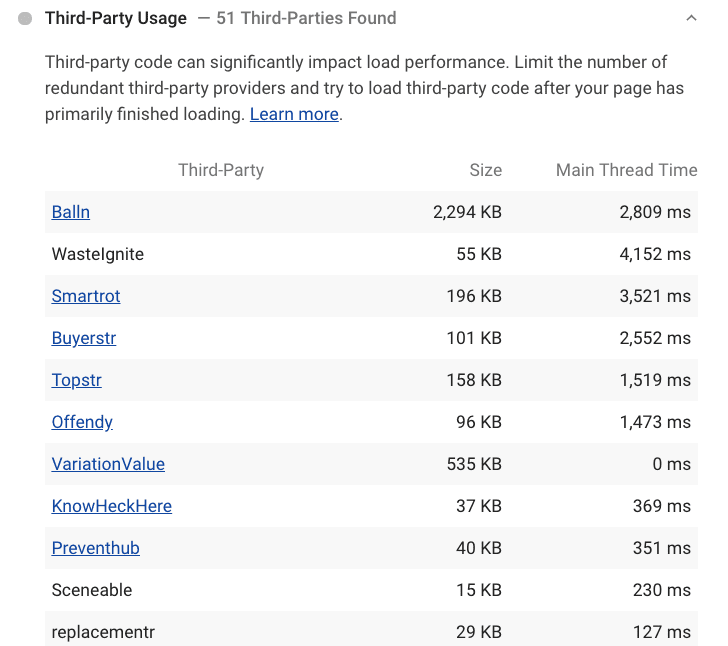
The Third-party usage audit lists all third-party providers loaded by the page. It's a useful overview for spotting redundant or overlapping services. This audit is available in the Lighthouse extension and was scheduled to land in DevTools with Chrome 77.
Measure script execution cost
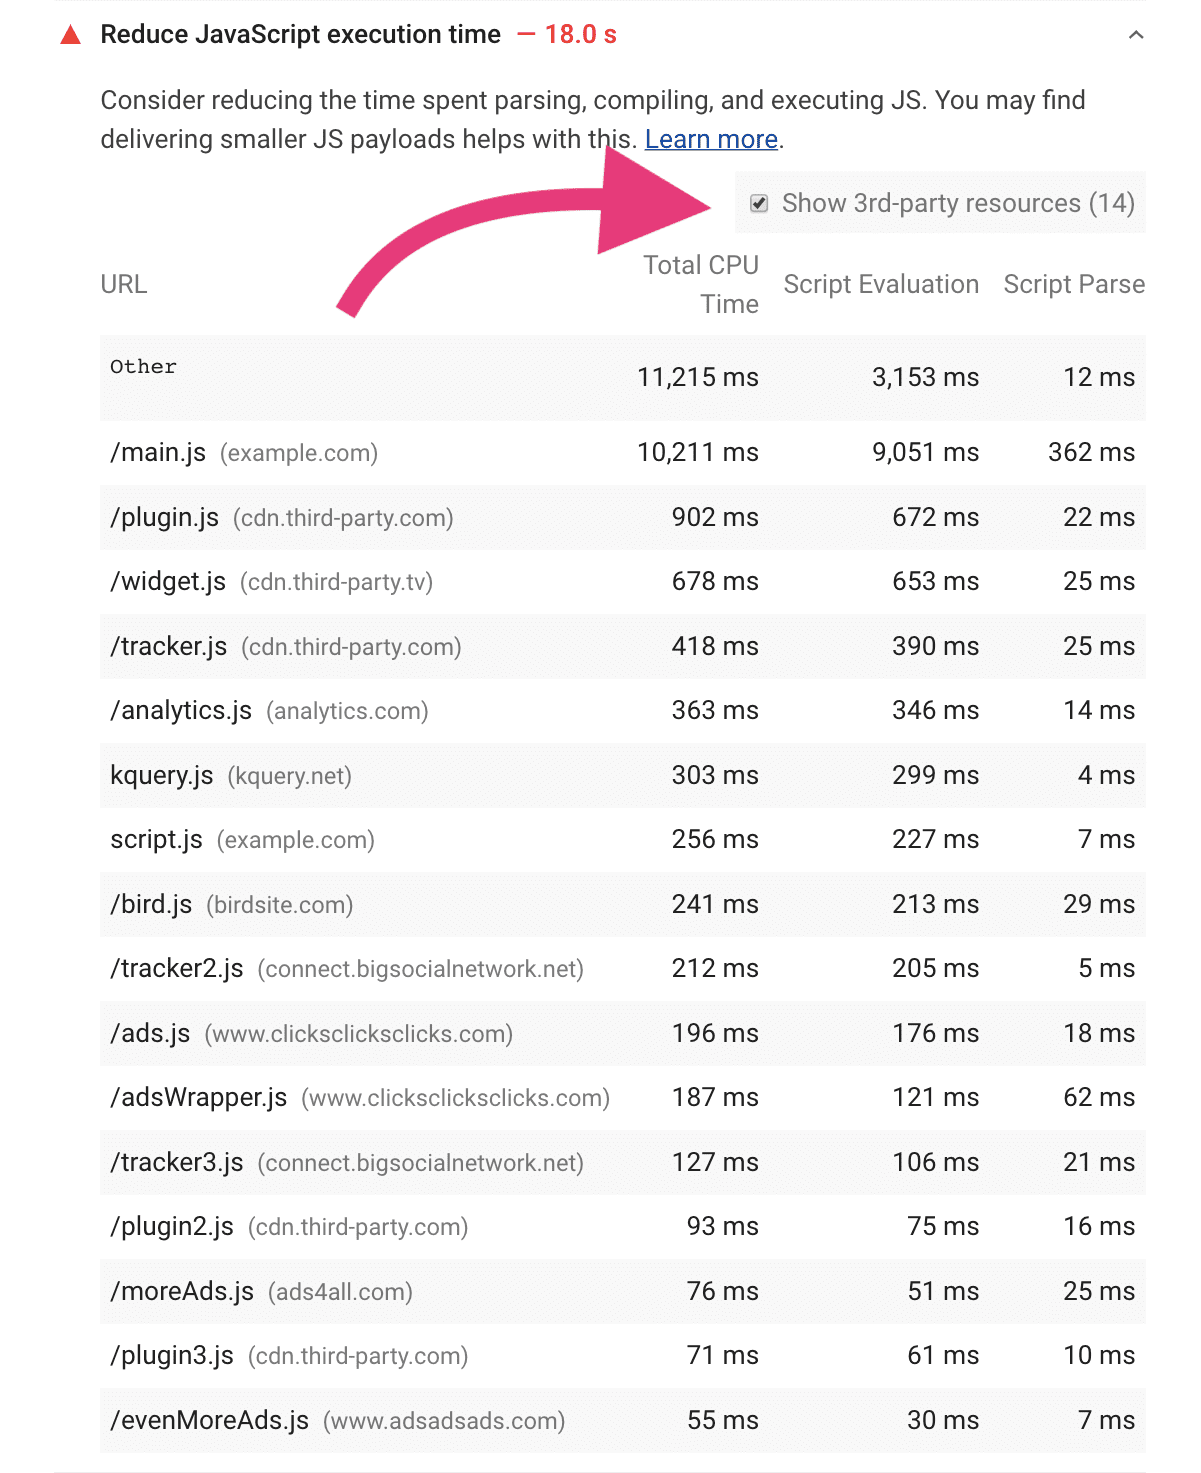
The Reduce JavaScript execution time audit points out scripts that consume excessive time for parsing, compiling, or evaluation. Enable the Show 3rd-party resources checkbox to filter for CPU-intensive external scripts.
Watch payload size
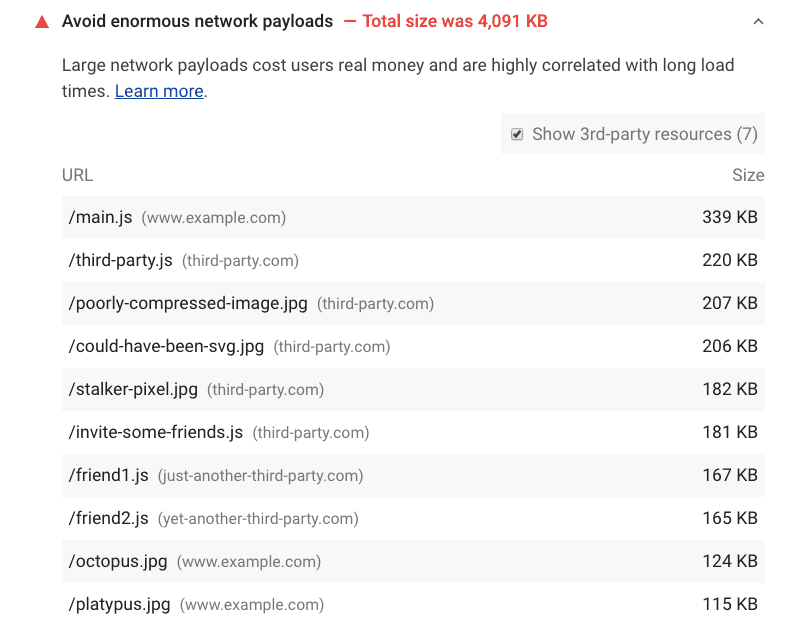
The Avoid enormous network payloads audit flags oversized network requests, including third-party ones, that can stall page load. The audit flags pages whose total network payload exceeds 4,000 KB.
Isolate culprits with request blocking
Once you have a suspect list, confirm the impact using DevTools' network request blocking. This feature lets you observe page behavior when a specific script, stylesheet, or resource is absent.
To enable request blocking:
- Press
Control+Shift+J(orCommand+Option+Jon Mac) to open DevTools. - Click the Network tab.
- Right-click any request in the Network panel.
- Select Block request URL.
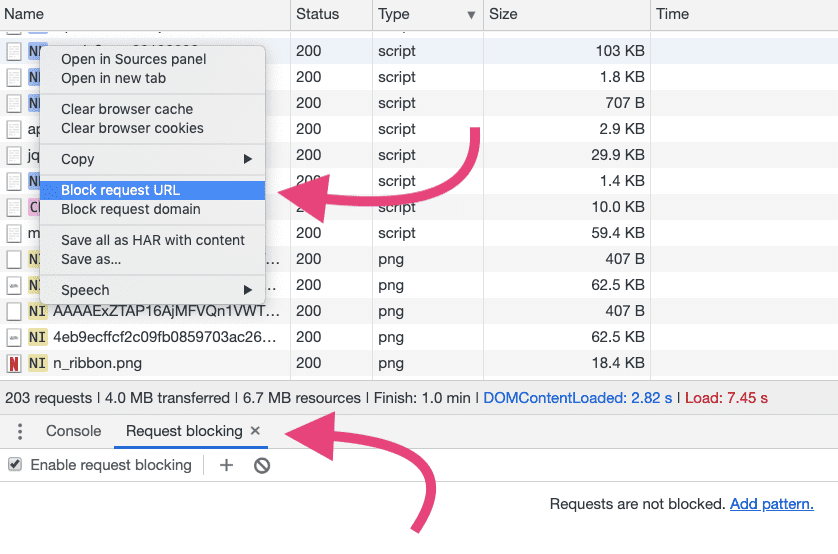
Blocked requests can be managed in the Request blocking tab in the DevTools drawer.
To assess the performance impact of blocked scripts:
- Measure page load time using the Network panel, ideally with network throttling and CPU throttling enabled. Results on desktop hardware and fast connections can mask the real cost experienced on mobile devices.
- Block the URLs or domains of the third-party scripts you suspect are problematic.
- Reload and re-measure page load time without those scripts.
If you don't see the expected improvement, narrow the list of blocked URLs until the culprit is isolated. For more stable results, run the measurement at least three times and compare median values—third-party content can vary from load to load. DevTools supports multiple recordings in the Performance panel to make repeated measurements easier.


