
Why class loading and JIT compilation slow down Android apps
Android apps ship Kotlin and Java code compiled into .dex files. Before any method in that bytecode runs, ART must load the method's parent class: locate its metadata, register it with the runtime, and initialize static state. Only after that can the method execute. Dex code is not machine code, so ART first runs the method through an interpreter while profiling it, and only compiles it with the JIT once it is identified as hot. Both class loads and the interpretation/profiling stage carry real runtime cost that users can perceive as slow startups, dropped frames, or sluggish responsiveness.
Those costs are recurring. Every cold start forces classes to be loaded again. ART can persist compiled methods across cold starts, but that requires a background dexopt run and gets invalidated by app version updates. (Android 14+ mitigates part of this with runtime app images.)
Meta's Android performance constraints
Meta's Android apps face two compounding performance problems. Startup is disproportionately important, yet the set of classes loaded at startup keeps growing as features like Instagram Reels or Messenger's End-to-End Encryption are added. Even infrastructure code—crash reporting, login auth, performance logging—participates in startup. Facebook and Instagram each load more than 20,000 classes on startup, with several thousand more needed for feed scrolling.
The second problem is post-startup user journeys: scrolling a feed or inbox, navigating to a profile, fetching and rendering a photo. Optimizing these requires understanding exactly which classes get loaded. That is difficult because the class-load profile varies dramatically across users, across days for the same user, and across weeks as both code and behavior change. The Meta monorepo receives thousands of commits daily, so there is no stable, one-size-fits-all profile to target.
Install-time optimizations: AOT and app images
Since Android 9, ART supports two install-time optimizations that address these costs directly. AOT compilation converts specified methods to machine code before the app first runs, eliminating the interpreter/profiling overhead on first execution. An app image is a file that holds a partial representation of ART's in-memory data structures for specified classes; when the app starts, the image is mapped into the process heap and fixups are applied, making those classes effectively loaded almost instantly.
Both optimizations are triggered by supplying ART a special profile at install time. There are two mechanisms for doing so: Cloud Profiles and Baseline Profiles.
Cloud Profiles are reactive and opaque
Cloud Profiles are aggregates of profiling data collected by Google Play from early users of an app version. Later installs of that version receive the profile, which ART uses for AOT compilation and app image creation. They have structural downsides for developers:
- Early users provide the data and get no benefit themselves.
- Developers cannot observe or control which classes and methods land in the profile.
- Generation is skewed heavily toward early startup improvement, not other journeys.
- The profile is only available through Google Play; sideloaded or other-store installs cannot use it.
Baseline Profiles put control in the developer's hands
Baseline Profiles serve the same purpose as Cloud Profiles but are generated and packaged by the app developer inside the APK or AAB. When both are present, ART can use them in tandem.
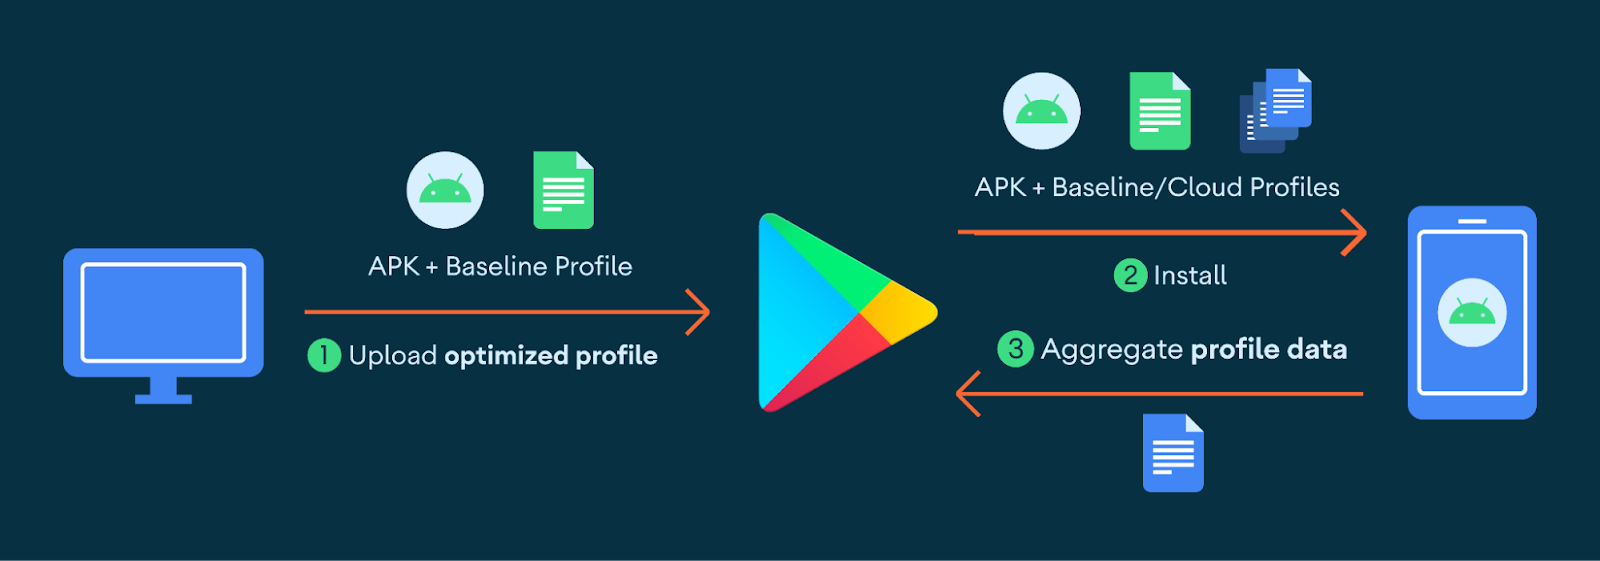
Because they ship with the app, Baseline Profiles benefit every user immediately—including the first ones. Developers can tune them for scenarios beyond startup, and can target classes and methods precisely. Google provides benchmarking tools like Macrobenchmark that generate profiles, but profiles can also be specified directly using the rule syntax and fed to the profgen tool, which gives fine-grained control.
Making Baseline Profiles work at Meta's scale
Given the breadth of code paths involved in both startup and the post-startup journeys Meta tracks, the central question was how to construct a Baseline Profile that covers the right ground. The approach rested on two foundations: understanding install-time AOT behavior in detail, and generating profiles that reflect real user behavior across the app.
Rather than relying on generic benchmarks or handcrafted rules alone, the team built infra-structure that analyzes class-load sequences drawn from many users, looking for commonality even across the wide variation described above. This gave insight into which classes and methods consistently contribute to the journeys worth optimizing.
Combined with tuning of profile generation—selecting which entries matter for startup versus navigation versus scrolling, and validating the tradeoffs in compiled code size versus runtime benefit—the resulting Baseline Profiles delivered measurable gains. Across Meta's apps, they improved performance for various critical metrics by up to 40%.
Building Baseline Profiles From Production Data
Meta's large Android apps load tens of thousands of classes on every cold start, and its weekly release cadence invalidates any optimized code with each new version. While ART's Cloud Profiles provided some relief, their automatic five-second startup cutoff left gaps in which classes were marked as essential. Baseline Profiles offered the control that Cloud Profiles lacked, so the company built a pipeline to generate its own profiles from a combination of benchmark data and aggregate production telemetry.
The earlier experiments began simply, using the static profiles that ship with AndroidX libraries. That approach scaled poorly for complex apps like Facebook and Instagram, where local benchmarks are not representative of real-world usage. To fill that gap, Meta collects class-loading data from users through a custom ClassLoader that logs each loaded class. This collection runs at a very low sample rate due to its performance cost, and the aggregated logs determine which classes appear frequently enough to qualify for the next release.
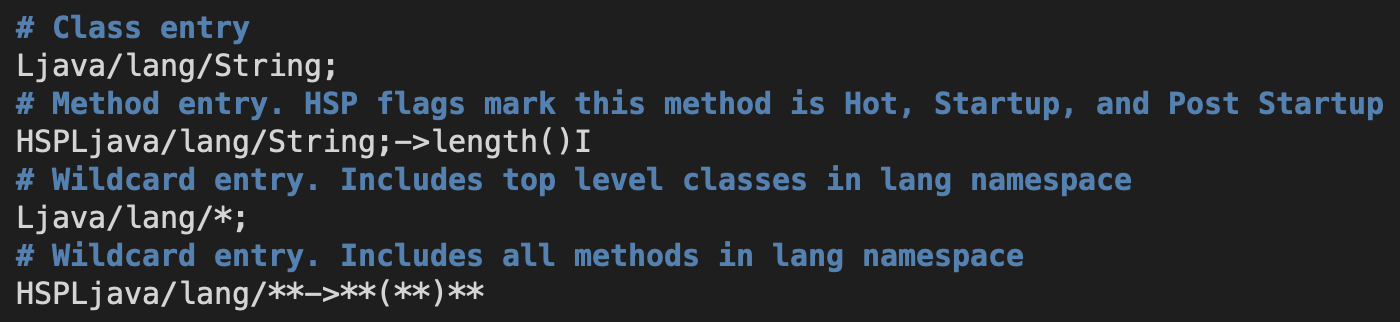
Method-level data is harder to capture because Android provides no hook for logging method invocations. Instead, Meta relies on specialized in-app telemetry to identify clusters of methods that users typically invoke, then samples and aggregates that data in a similar fashion. All sources — benchmark logs and production traces — funnel into a human-readable profile format that a tool called profgen compiles into the final Baseline Profile. In this format:
- Lines beginning with
#are comments. - Classes may be specified directly by descriptor.
- Methods are listed with optional flags.
- Wildcards match any class or method sharing a prefix.
Tuning the Profile Size
The first optimization target was cold start, and the initial inclusion thresholds were deliberately strict, requiring a class or method to appear in 80–90% of all collected traces. The caution was warranted: compiled machine code is roughly 10 times larger than interpreted code, and oversized profiles can introduce I/O costs through page faults or cache misses.
Subsequent experiments loosened those thresholds and expanded the use case beyond startup. Most apps now include items appearing in at least 20% of cold start traces, and profiles cover newsfeed scrolling, thread-list-to-thread navigation in Messenger and Instagram Direct, and general cross-surface navigation latency. Growth has been gradual — startup regressions occasionally appeared when profile size increased, usually with signs of rising memory pressure — but carefully measured additions have allowed profiles to grow considerably beyond early expectations.
Measured Results
Rolled out across all major Meta Android apps, Baseline Profiles have delivered consistent improvements in app start, scroll performance, and navigation latency. Across these critical metrics, measured gains range from 3% to 40%. The profiles now contain tens of thousands of entries per app, and the recurring experimentation cycle is a permanent part of the performance strategy — the cost and effort have paid for themselves repeatedly in user-facing wins.


