

The Middle Tier Between Metrics and Logs
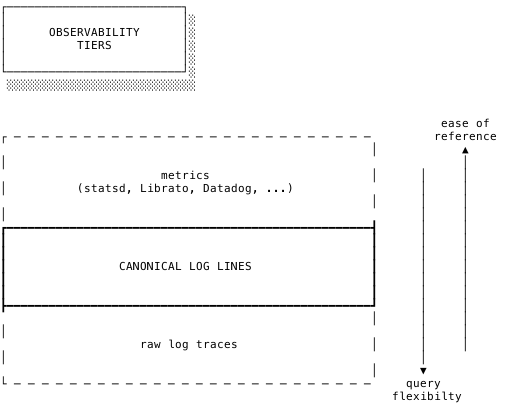
Production systems typically emit two tiers of operational data. Metrics pushed to services like statsd or Datadog give fast feedback on known measurements — request rates, error counts, latency percentiles — but they only answer questions you thought to ask ahead of time. Raw log traces can answer arbitrary questions, but their poor signal-to-noise ratio makes ad-hoc analysis painful even with sophisticated tools like Splunk.
The canonical log line is a lightweight pattern that sits between these two tiers. One structured log line is emitted at the end of each request, carrying every key piece of information about that request in a queryable format:
One Big Line Per Request
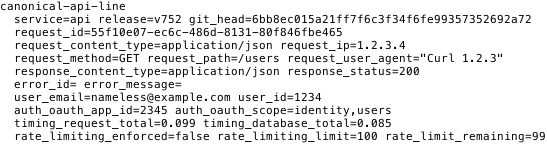
Rather than scattering request data across many log entries, a canonical line consolidates everything relevant into a single logfmt entry emitted when the request completes. Typical fields include:
- HTTP verb and path
- Source IP and user agent
- Request IDs for cross-referencing with the raw trace
- Response status
- Error ID and message for failed requests
- API key ID, OAuth application, and scope
- Authenticated user ID and email
Internal metadata fits naturally into the same line: service name, Git revision, release number, request duration, database time, and rate-limit values. Here's an example in logfmt (line breaks added for readability):
Storage Options
Canonical lines are only useful once they're queryable. Stripe routes them to two complementary destinations.
Real-Time Log Aggregator
Splunk serves as the short-term store for operational work. Its query syntax is terse, results come back quickly when scoped to a recent time window, and data ingested directly from syslog is available almost immediately. Because every line carries request IDs, you can join canonical lines against the raw trace for any request.
The downside is cost. Splunk licensing and storage are expensive, and retention is capped by total capacity — at 1,000 requests per second, a single 200-byte canonical line adds 15–20 GB of data per day. Operations teams often prune raw traces from high-traffic systems to stay under quota.
Data Warehouse
Redshift (or any comparable warehouse) provides the long-term archive. Tables remain queryable at arbitrary size, storage is cheap enough to keep canonical lines for extended periods — Stripe prunes after 90 days but longer retention is feasible — and importing non-request data like user records enables joins across sources that Splunk can't do.
Ingestion runs through a fast queueing system: a daemon on each node buffers lines and ships batches to Kafka, which archives to S3, and Redshift periodically runs a COPY from the bucket.
Real-World Queries
HTTP 500s by Failure Type
Scoping canonical lines to a single API endpoint turns an error dashboard into a drill-down tool:
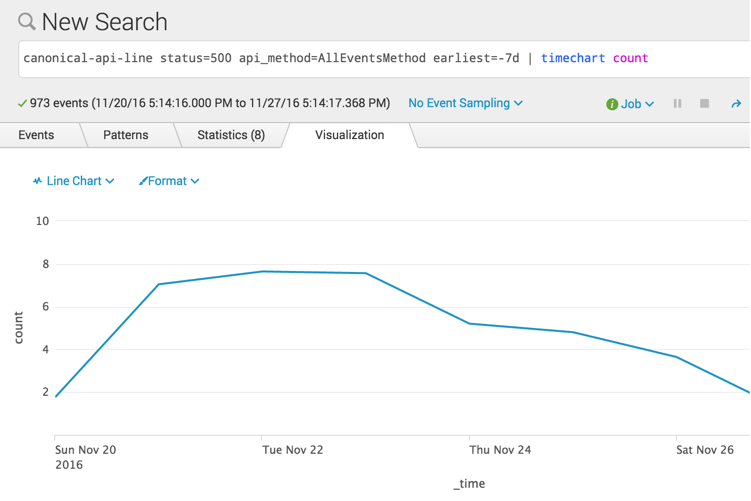
canonical-api-line status=500 api_method=AllEventsMethod earliest=-7d | timechart count
(Numbers shown are artificial and not representative of Stripe API traffic.)
Subsearches let you join canonical lines with exception logs emitted separately. Grouping by error class reveals which failures dominate an endpoint:
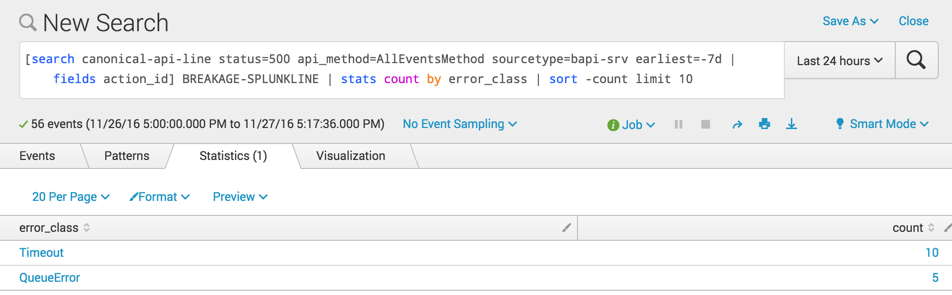
[search canonical-api-line status=500 api_method=AllEventsMethod sourcetype=bapi-srv earliest=-7d | fields action_id] BREAKAGE-SPLUNKLINE | stats count by error_class | sort -count limit 10
Reversing the join — starting from the breakage line, then pulling fields from the canonical line — shows error distribution by API version:
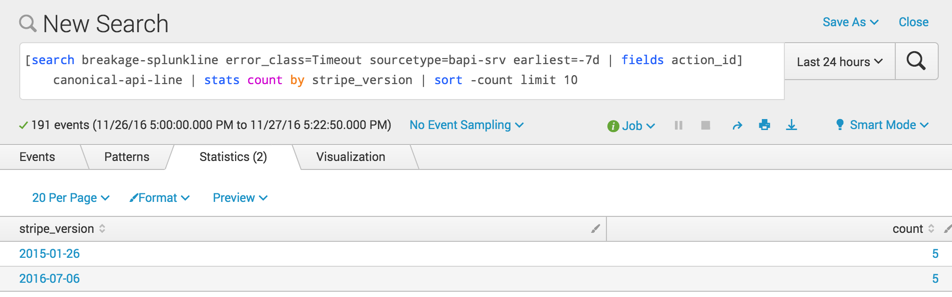
[search breakage-splunkline error_class=Timeout sourcetype=bapi-srv earliest=-7d | fields action_id] canonical-api-line | stats count by stripe_version | sort -count limit 10
Profiling Old TLS Versions
When helping Stripe users migrate from TLS 1.0 and 1.1 to TLS 1.2 (required for PCI compliance), the same Splunk queries kept recurring across support questions. A dashboard built entirely from canonical log lines answered each query automatically: search for a user's canonical lines, exclude internal traffic, tabulate protocol and other fields.
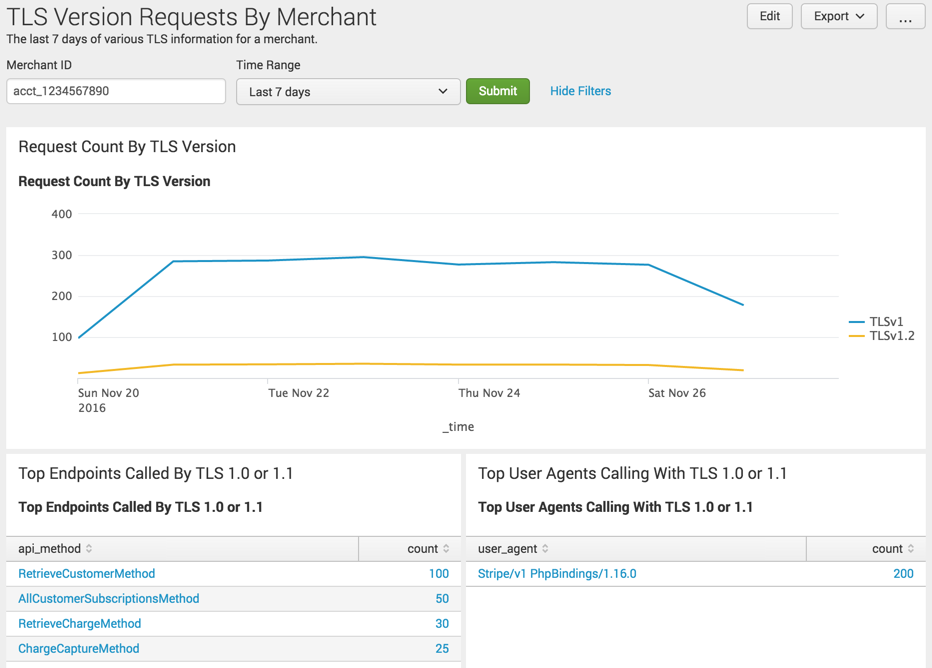
The same analysis works in Redshift. This query finds users who made API requests over pre-1.2 TLS within the last week (a lexical comparison works because TLSv1, TLSv1.1, and TLSv1.2 sort in age order):
SELECT distinct(user_id)
FROM canonical_lines.api
WHERE created > GETDATE() - '7 days'::interval
  AND tls_version < 'TLSv1.2'
ORDER BY 1;
A Minimal Rack Middleware Implementation
Middleware is a natural home for canonical log lines. Install it near the top of the stack so downstream middleware and application code can populate fields through a shared context object (env in Rack), then emit the finalized line at the end.
# A type containing fields that we'd like to populate for
# the final canonical log line and which can encode itself
# in logfmt format.
class CanonicalLogLine
  # service information
  attr_accessor :service
  attr_accessor :release
  attr_accessor :git_head

  # request identification
  attr_accessor :request_id

  ...

  def to_logfmt
    ...
  end
end

# A middleware that injects a canonical log line object into
# a request's # context and emits it to the log trace as the
# rest of the stack has finished satisfying the request.
class CanonicalLogLineEmitter < Middleware
  attr_accessor :app

  def initialize(app)
    self.app = app
  end

  def call(env)
    line = CanonicalLogLine.new
    env["app.canonical_log_line"] = line
    ...

    app.call(env)

    # Emit to logs.
    log.info(line.to_logfmt)
  end
end
A complete middleware stack shows how the components fit together:
App = Rack::Builder.new do
  # Top of the middleware stack.
  use CanonicalLogLineEmitter

  # Other middleware.
  use Cache
  use Deflater
  use ErrorHandler
  use RequestID
  use SSL

  run Main
end
A Practical Trade-Off
Canonical log lines occupy the space between prebuilt metrics dashboards and raw log traces. They lack the instant convenience of statsd-style charts, but they handle arbitrary ad-hoc questions far better. They don't capture every detail the way a raw trace does, but the signal density makes them far quicker to query. And since they're emitted as plain log lines, the pattern ports to any language or framework without special infrastructure.


