

When Product Growth Becomes Product Hoarding
Digital product teams rarely set out to create a sprawling, hard-to-maintain portfolio. It usually starts with a legitimate need: a bespoke solution for an important enterprise client, a quick experiment for a consumer segment, or a feature that was promising but never quite took off. Each addition makes sense at the time. Over years, though, the cumulative result is a portfolio of highly customized products that quietly violate two core principles:
- The portfolio should serve your core customer segments and their actual needs.
- The portfolio should weigh short-term bespoke wins against long-term maintenance costs, while staying aligned with the business strategy.
The consequences are predictable. Every bespoke product requires ongoing maintenance, and that burden grows more costly and complex with each passing year. The cleanup effort, meanwhile, is easy to postpone in favor of seemingly more urgent work. The problem is that a cluttered portfolio makes it hard to see which products genuinely deliver value — and which are simply consuming resources.
The Cost of an Overstuffed Portfolio
Overgrown portfolios have many origins. In B2B organizations, they often come from crafting tailored solutions for high-value enterprise clients. In B2C settings, they might come from testing new features with particular customer groups. Incentive structures frequently play a role too. Whatever the cause, the logic is consistent: the more bespoke the portfolio, the harder it becomes to keep it coherent. As Marie Kondo might put it, in a messy cupboard, it’s impossible to find what truly sparks joy — where joy translates into customer value and business revenue.
The challenge of decluttering is compounded when an organization has not historically tracked product performance. In a globally distributed not-for-profit organization undergoing a major transformation, for example, a "Product Kondo" exercise had to begin with almost no user analytics data. For over 20 years, the organization had collected and distributed data in multiple formats — from raw data to modelled data, scores, and advanced data products — but product centricity and strategic differentiation were never core concerns. With few performance indicators to lean on, the task was to map and simplify a large legacy portfolio largely from scratch.
When you have minimal data on product performance, how do you identify where the value in your portfolio actually lies — and what should drive the cleanup?
In this case, the cleanup was driven by two forces from a broader organizational transformation: the need to simplify the portfolio to cut maintenance costs and reduce the technical burden of migrating to a new platform, and the need to align future development with a newly formed business strategy. Cost reduction and future planning were the primary motivations.
When “Product” Means Many Things: Cleaning Up a Legacy Portfolio
If your organization has spent years adding features without ever retiring them, a “Product Kondo” exercise—systematically decluttering the portfolio—may be necessary. The approach requires two kinds of transparency: clarity about the need to simplify, and clarity about how decisions will be made so teams can contribute meaningfully.
Buy-in matters most in large companies, where someone always argues “we need everything,” customer segment importance is unclear, and no accurate portfolio overview exists. If you cannot assess your current portfolio, you cannot plan strategically or break free of delivery mode—simply building what gets requested rather than driving future growth.
When you must organize a portfolio with limited information, four workstreams help: defining who matters, establishing the status quo, agreeing on evaluation criteria, and ensuring buy-in.
Defining For Whom: The Segmentation Foundation
Start with primary and secondary customer segments. If teams are to focus, priorities must be explicit. Building a user segmentation matrix—identifying external user groups, understanding their differences, and assessing their business importance—grounds prioritization in real needs.
Beyond documenting jobs-to-be-done, goals, and pain points per segment, the matrix promotes transparency about:
- Thinking from the customer's perspective.
- Using measurable data: user counts, account sizes, revenue.
- Acknowledging that some user groups deserve higher priority than others.
This segmentation was the shared mental model introduced across teams before any simplification effort began.
Establishing the Status Quo: Audit First
Before sizing the effort, understand what previous attempts had produced. The organization's sprawling catalog mixed many item types without clear definitions or categorization. An audit updated a three-year-old product catalog with information relevant to assessing value—revenue, user numbers, and development effort had never been systematically tracked, so product owners supplied these details.

Agreeing on How: Scoring and Reality Checks
Transparent decision-making requires agreed evaluation criteria and scoring aligned with stakeholders upfront. All 36 product owners submitted data for each product, though initial responses were vague with many blank cells. One-on-one interviews improved data quality, allowing missing information to be filled with documented “best guess” assumptions rather than left empty—an imperfect but practical approach grounded in domain expertise.
Criteria like “automation potential” were difficult for less technical product owners to assess. Adopting a product mindset—“done is better than perfect”—the team proceeded once the emerging picture was sufficiently reliable. Data quality improved through manual input cleaning (deduplication) and follow-ups until inputs were clear. Predefined ranges also produced better data than asking for hard-to-quantify inputs such as expected impact.
Scoring and the Reality of the Weighted List
Defining scoring methodology upfront aligned stakeholders on criterion relevance. Given that simplification directly impacts teams, open communication about the goal—reducing cost and maintenance while preparing for future growth—was essential.


The ranked list initially suggested a straightforward outcome: cut the bottom half and migrate the rest to a new technical platform. But reality intruded. The “product portfolio” actually contained 12 different item types, and roughly 70% were not genuinely products. Trackers, tables, graphs, extracts, datasets, dashboards, reports, and tools were all labeled “products,” while many low-ranked internal tools underpinned highly ranked customer-facing offerings. The list compared apples to oranges; cutting the bottom half would collapse the entire structure, especially given the dependencies between items.
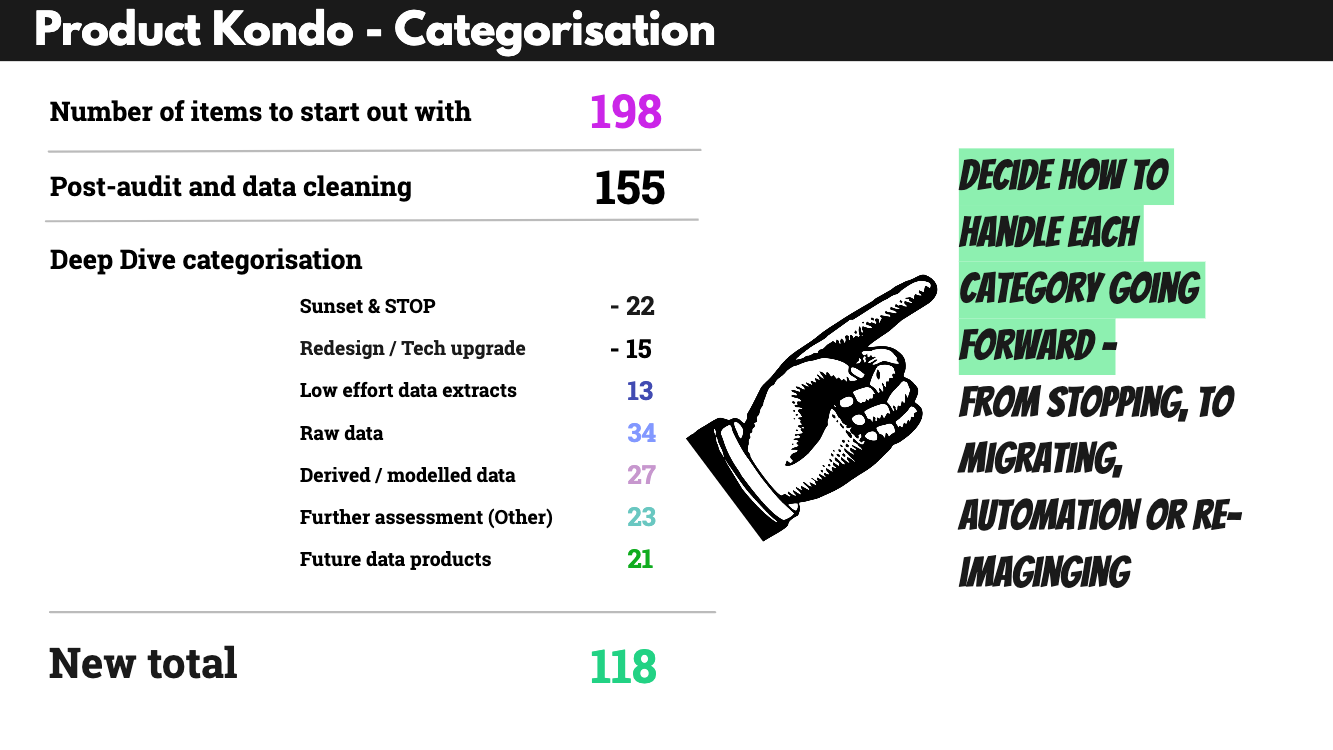
Working with leadership, the team explained the categorization gap and the risks of naive cutting. They proposed that key product owners and leaders help categorize the portfolio correctly. Five buckets enabled sorting, deliberately keeping an “other” category minimal. This categorization allowed different handling per group going forward—for instance, raw data items were targeted for automation, low-effort items required no process changes, and a “Sunset/Stop” category let stakeholders volunteer items for removal during workshops rather than via top-down directives.
Ensuring Buy-In: Product Trees in Practice
Seven workshops per customer segment brought subject matter experts into the process. Held on Miro boards with audit findings shared in advance, each 3-hour session involved 4–6 participants categorizing items. To avoid groupthink, attendees pre-clustered their portfolio portion.
The “product tree” concept, adapted from Luke Hohmann's “prune the product tree” innovation game, provided the organizing framework. Hohmann used the metaphor to imagine new features; here, it was repurposed to map the current portfolio and actively reduce it.

In this model, the roots signified raw data, the trunk represented modeled or derived data, the crown comprised data products, and the outer branches held unclassifiable “other” items. The metaphor also guided future handling: automate raw data first, check modeled data for complexity, and treat genuine data products as strategic assets for reimagining from a product perspective.
The structure gave participants a shared mental model for grouping items by customer segment, helping them determine value within the portfolio. Feedback after each workshop indicated that joint mapping and visualization built trust in the process and fostered a sense of active contribution—key outcomes when asking teams to reduce what they have built over the years.
Visualizing the Portfolio: Swimlanes and Product Trees
Bringing the workshop outputs together showed that prioritization was anything but linear. To capture that complexity, we layered several views over the raw ranked lists:
- Data items were organized as a product tree, with each cluster assigned its own swimlane.
- Usage across customer segments was expressed through color-coding.
- Dependencies between items were shown by the frame type around each element.
- Quantitative ranking was added through numbering and additional color-coding.
After each workshop, the boards were tidied up to preserve the important comments, particularly notes about future treatment, such as when a legal obligation to deliver would expire.

The swimlanes helped participants group similar data items, while the tree metaphor made the dependencies between them explicit. This is especially useful for data products, where raw data sits at the root of everything built on top of it — scores, modelled datasets, automated reports, or more advanced offerings.
Performing the Product Kondo exercise also helped teams and stakeholders agree on how the portfolio was actually structured for each customer segment. The combination of swimlanes, colour-coding, and frame styles conveyed a complex reality that a simple ranked list never could.
Only with this mapped portfolio — after merging both quantitative and qualitative input — could teams make sound calls on each item’s future. Items under “raw data” would be automated as part of the wider transformation; those under “sunset” would not move to the new platform. The “low effort” group stayed manual, while “derived & modelled” items went to a team of tech leads for further automation assessment. The items central to the future business strategy were the “data products” — those that had to be reimagined around customer needs, guided by the user segmentation matrix.
Key Learnings From the Clean-Up
The portfolio went from 198 items to 118, a reduction of 67.8%. But the real value wasn’t the raw cut — it was the categorization. The product tree visualization gave everyone a shared view of how items connected, showing the core product as the roots and more advanced products or features as the branches. Similarly, the swimlane categorization stopped teams from comparing apples and oranges in the portfolio audit table, making it obvious that not every item could be judged by the same criteria.
There’s no single correct way to label swimlanes, but a useful starting point is to name clusters from basic to complex, and always include a “sunset/stop” bucket plus one for “redesign/tech upgrade.” Those two categories force contributors to engage with the quick wins — usually the most outdated parts of the portfolio.
Whether you’re categorizing for a transformation or just to keep things lean, clustering your portfolio and understanding how it serves each customer segment is a valuable sense-making exercise in itself.
Shared Terminology Matters
The biggest takeaway was that
Terminology matters because simply referring to things as “products” doesn’t make them so. Comparing like for like is a key factor when assessing a product portfolio.
Getting the categorization right was the hardest part — and it had to come before anything else, so the organization could focus on where to play and reimagine products that fit the future strategy.
When Theory Meets Reality
The exercise had to pivot toward mapping because we hadn’t accounted for inconsistent terminology across the organization. Instead of simply gathering and ranking, the major task became correctly categorizing and structuring. That’s likely to vary from organization to organization. If you’re unsure about what you’re comparing, include a clustering or mapping exercise from the very start.
Why Product Kondo Is the Groundwork for Transformation
If you’re stuck with a large legacy portfolio and no longer trust that everything in it serves a purpose, it’s time to clear things out.
Focusing on the next shiny thing is often necessary, but without balancing it against cleaning up your existing portfolio, your organization will eventually slow down. Overgrown product portfolios can’t be sustained forever.
For organizations bound by contractual obligations, this clean-up is what allows product teams to actually iterate. Running the effort across teams also makes change visible and gives people a way to contribute. Business decisions still have to be made, but doing so with transparency and an evidence-guided approach helps bring people along.

If a full portfolio clean-up — which took us roughly four months with a core team of about four people — isn’t feasible, start smaller. Build the discipline into your everyday routines: whenever you launch something new, ask whether an older product or feature should be stopped or sunset. Or map the categories in your portfolio now, using swimlanes and the product tree metaphor. What’s core today, and what defines the future state of play?
Upside: Once you’ve got the full overview and identified what to sunset or slim down, there’s more capacity for strategic priorities.
Reality check: The work continues. The next step is to tie the portfolio back to your user segments and assess how well it serves each one, especially the primary segments.
Further Reading
- “Product-Led Growth: The Ultimate Guide for Software Companies,” Userpilot
- “Evidence-Guided: Creating High-Impact Products in the Face of Uncertainty,” Itamar Gilad
- “Innovation Games: Exploring Luke Hohmann’s Game-Changing Approach,” Matt Hicks
- “Building A User Segmentation Matrix To Foster Cross-Org Alignment,” Talke Hoppmann-Walton
- “What Is A Product Portfolio Roadmap?,” Kareem Mayan



