
Controlled Experiments: Ten Lessons From a Year of A/B Testing
Running controlled experiments is the gold standard for measuring the true impact of a product change. In the past year, we wrapped up ten online experiments. These are the hard-earned lessons we learned along the way.

Choosing the Right Randomization Unit
When we set out to measure the impact of our multi-currency offering on the user experience, we needed an experimental design. My first instinct was to randomize at the session level and measure conversion rates, as we had well-structured session-grain data readily available. The setup looked simple: each incoming session was split evenly into two groups.

However, this approach has a hidden flaw. Users often have multiple sessions on a store before making a purchase. A user could be assigned to the control group in one session, but later be placed in the treatment group for a subsequent session. The experience from the latter session could easily influence the eventual purchase that is attributed to the former. In practice, this means your results may not reflect the true effect of your change. A user’s experience should be consistent; random units need to be independent and preserve a coherent user experience.

The Value of Running Simulations
Based on that, we pivoted to user-level randomization. We kept session conversion rate as our primary metric because it was already modelled and well understood internally. But mixing a user randomization unit with a session analysis unit comes with warnings: several sources suggested that this mismatch can inflate the false positive rate. The concern is that users with many sessions and extreme conversion rates can disproportionately shape the aggregate metric for their group.
Instead of abandoning our plan or accepting an alternative strategy outright, I built a simulation to test the scenario. We ran many simulated experiments with our real population, randomizing by user and comparing session conversion rates as we planned. When we checked the false positive rate in the simulations, it was acceptable. It was enough confirmation to keep our original experimental design.

Data Informs Both Large and Small Decisions
We planned an experiment for a new geolocation recommendations design precisely when the legacy system that rendered our website content was being phased out. At that moment, the old "Renderer 1" still served roughly 15 percent of traffic, raising the question of whether we needed to implement the experiment in both codebases. Digging deeper reshaped the problem. Because we would only serve the treatment or control experience on the first request of a session, the relevant question changed from the overall traffic split to the share of first requests in our target user group.
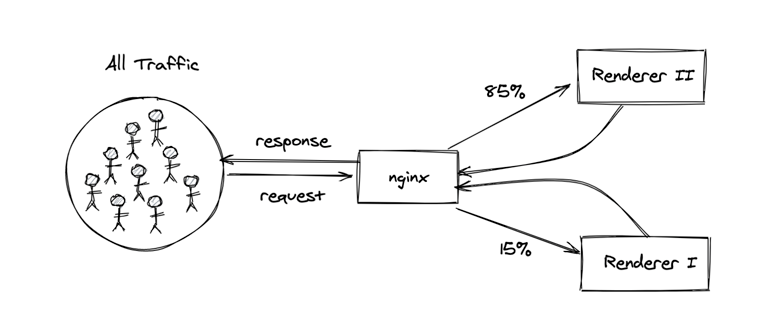
Analysis showed that nearly all relevant first requests went to the new system. We could safely implement in one codebase, saving two days of work with just two hours of scoping. This only surfaced because we were tightly embedded with the engineering team, attending their standups and hearing the small, pragmatic questions that rarely reach data scientists otherwise.

System Understanding, Logging, A/A Tests and SRM
We launched an A/A test to ensure that a redirect implementation didn't introduce unwanted side effects on our metrics. The flow was straightforward: when a user in the test group requested a URL, the server responded with a 302 redirect to the same URL. A cookie was set to prevent a loop, and the user would then fetch the page content normally.
Shortly after launch, we noticed an issue: the fraction of users assigned to the test group in our sessions system was slightly lower than control, an early sign of sample ratio mismatch (SRM). We weren't seeing the intended 50/50 split among the users logged as session records.
Investigating required a deep understanding of that system. The sessions model is built by aggregating client-side pageview events. A user in our test group could drop off after the redirect without executing the client-side code to emit those events.
To verify this, we implemented new, lightweight Kafka logging for each request with relevant metadata. We suspected bots because they often don't follow redirects. Filtering out suspicious user agents and IP ranges reduced the mismatch but didn't eliminate it. We couldn't reliably filter every bot, and some human users were likely lost as well. The culprit was enough to make me adjust both the data source for my metric and the audience definition.
The lessons were clear:
- Develop a deep understanding of your system: only by tracing the data pipeline could we explain the SRM and find a path forward.
- Log generously: the extra diagnostic logging we added became part of our final metrics once its value was proven.
- Run more A/A tests: without that pre-flight check, this mismatch would have plagued the real A/B test, and we would have had no baseline for interpreting the redirect effect.


User Skew and Daily Monitoring
Another experiment measured the impact of translating content into a buyer’s language. Eagerly watching the results daily is often discouraged, but I continued to peek because I was invested in the outcome. For over a week, the treatment group’s advantage held steady before suddenly collapsing in the final days.
When I looked into it, the change was driven by a single store with unusually high volume. Since we use rate-based metrics, that store’s activity was swaying the entire population. This is a stark reminder to watch for user skew: high-volume customers can easily dominate aggregate metrics. A combination of daily peeking plus a commitment to using a preplanned sample size allowed me to catch this aberration at the end and remove the offending outlier rather than interpret a false result.

When the Expected Isn't What Happens
A redirect experiment at Shopify hit a sample ratio mismatch (SRM), with one group logging far more sessions than expected. Past incidents of this type had been traced to bots ignoring redirects or unusual browser behavior. The evidence, however, pointed elsewhere.
Digging into the application code and experiment qualification logic revealed the real culprit: a cookie set during a user's first session was disqualifying all of that user's returning sessions from one group. For ecommerce, this is a critical flaw. Returning buyers are far more likely to convert than new visitors, so comparing a group that includes all sessions against one that only contains first sessions is not a fair test. Switching the analysis unit from session to user—so that every session from a user counted—flipped the experiment's result from negative to positive.
The lesson here is simple: go down rabbit holes. Not every deep investigation yields such a dramatic reversal, but there is always something to learn from chasing an anomaly.
Averages Hide the Details
There is a strong temptation to look at an experiment's overall result, see a positive lift, and roll out the feature. That can be a costly shortcut.

Since results are reported across all segments, it pays to remember that we're measuring averages. A positive average does not mean the change benefits every user, and a negative average does not mean it hurts everyone. Slicing results by key segments—device type, browser, customer demographics—can expose problems that the headline number hides. Perhaps a design breaks in a specific browser, or a particular buyer group is especially sensitive to the change. Those findings are just as actionable as the overall result and can inform product decisions or mitigation steps.
Carrying These Lessons Forward
The full set of takeaways from running experiments at scale:
- Think carefully when choosing your randomization unit
- Simulations are your friend
- Data can, and should inform both big & small decisions
- Understand your system
- Log generously
- Run more A/A tests
- Beware of user skew
- Don't be afraid to peek
- Go down rabbit holes
- Remember, we're measuring averages
Each of these emerged from real incidents where skipping the extra check nearly derailed an experiment—or where chasing the unexpected saved one.


