Memory management fundamentals
JavaScript uses automatic garbage collection, but that doesn't mean memory management can be ignored. Applications written in JavaScript face the same memory leaks and bloat as native applications, plus the added complication of garbage collection pauses. Even large-scale applications like Gmail run into these problems. The path to fixing them starts with understanding how JavaScript represents and tracks memory.
JavaScript has three primitive types: Number (for example, 4 or 3.14159), Boolean (true or false), and String (such as "Hello World"). These types cannot reference other values, making them leaf nodes in the object graph with no outgoing edges.
The single container type in JavaScript is the Object, which behaves as an associative array. A non-empty object is an inner node with outgoing edges to other values. Arrays, while conceptually distinct, are in practice Objects with numeric keys — though JavaScript runtimes often optimize array-like structures into true arrays under the hood.
The object graph and garbage
Every value in JavaScript lives in the object graph. The graph starts from roots, such as the window object. You don't control the lifetime of these roots — the browser manages them and destroys them when the page unloads. Global variables are simply properties on window. A variable is a name that references a value, while a property is a name in an Object that references a value.
A value becomes garbage when no path exists from any root to that value. In other words, if you start at the roots and exhaustively search all live Object properties and stack frame variables, and a value is unreachable, it is garbage.
Leaks and bloat
Memory leaks in JavaScript most commonly happen when DOM nodes escape the page's DOM tree but remain referenced by JavaScript objects. For example, if you append an element to the DOM and keep a reference to it, then later remove that element from the display list, the DOM element will not be freed as long as your JavaScript reference exists — even if the node is detached from the page's main DOM tree.
Bloat is distinct from leaks: your page is bloated when it consumes more memory than needed for optimal performance. Leaks can indirectly cause bloat, but bloat often appears on its own. An application cache without any size bound is a typical culprit, as is host data like image pixel data.
How V8 collects garbage
Garbage collection is how JavaScript reclaims memory, and the browser decides when it runs. During collection, all script execution pauses while a traversal of the object graph identifies live values, starting from the GC roots. Anything unreachable becomes garbage and is reclaimed by the memory manager.
V8 uses a generational collector with two generations: young and old. Allocation and collection in the young generation are fast and frequent. In the old generation, they are slower and less frequent.
Young generation
An object's age is measured by the number of bytes allocated since it was created, often approximated by the number of young generation collections it survives. Once an object is sufficiently old, it is tenured into the old generation.
In practice, fresh allocations are short-lived. Studies of Smalltalk programs found only 7% of objects survive a young generation collection, and across runtimes, between 70% and 90% of freshly allocated objects are never tenured.
The young generation heap is split into two spaces, from and to. Allocation happens in the to space. When it fills, a young generation collection swaps the two spaces and scans live objects in the old to space, copying survivors into the new to space or tenuring them into the old generation. A typical young generation collection takes about 10 milliseconds. That means each allocation brings you closer to the next pause. For game developers targeting 60 frames per second with a 16ms frame budget, that effectively means making zero allocations in a frame, since one young collection can consume most of a frame.
Old generation
The old generation uses a mark-compact algorithm. Allocations into the old generation occur only when objects are tenured from the young generation. An old generation collection also triggers a young generation collection and can pause your application for seconds. This is acceptable only because old generation collections happen infrequently.
Automatic memory management improves developer productivity, yet every allocation brings you closer to a pause that can introduce jank into your application. Understanding these mechanics lets you make allocation choices that keep garbage collection interruptions at bay.
Tracking Down Memory Problems in Long-Running Web Apps
For applications that stay open for days at a time, memory growth is a silent killer. Gmail's engineering team faced exactly this problem, and over the past year they've used a combination of new browser APIs and Chrome DevTools features to identify and fix the root causes. Along the way, they also uncovered a few bugs inside Chrome itself.
The Data: Collecting Memory Statistics from Real Users
Since Chrome 22, the performance.memory API has been enabled by default, making it possible for any web application to gather memory statistics from real users in the field. This data is critical for distinguishing between power users—who might spend 8-16 hours a day in Gmail—and average users who only check a few messages a day. The API provides three key values:
jsHeapSizeLimit: The total amount of memory (in bytes) the JavaScript heap is limited to.totalJSHeapSize: The total memory (in bytes) the heap has allocated, including free space.usedJSHeapSize: The memory (in bytes) currently in use.
One caveat: this API returns memory values for the entire Chrome process. If multiple tabs share a renderer process, the numbers will include memory from those other tabs as well.
Measuring at Scale
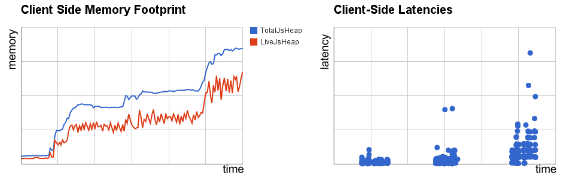
Gmail's team instrumented its JavaScript to sample memory data roughly every 30 minutes from a random subset of users. Because many users leave Gmail open for days, this provided a clear picture of memory growth over time. Within days, the team had enough data to understand how widespread the problem was and set a baseline for improvement.
That field data also challenged a common assumption: that more memory means better performance. In Gmail's case, larger memory footprints correlated with longer latencies for common actions. This finding motivated the team to aggressively reduce memory consumption.
Reproducing and Isolating Leaks with DevTools
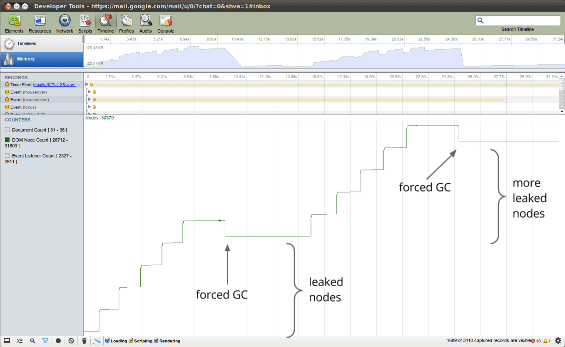
Before fixing a problem, you need to prove it exists and create a reproducible test with a baseline measurement. The DevTools Timeline panel is the right place to start. Its Memory mode tracks total allocated memory, DOM node count, window objects, and event listeners over time.
To test a suspected leak, record a timeline while performing a specific sequence of actions, then force a full garbage collection using the trash can button at the bottom of the panel. If the DOM node count doesn't drop back to its original baseline after several iterations, you have strong evidence of a leak. A sawtooth-shaped memory graph without a rising baseline indicates you're allocating many short-lived objects—which may be a separate performance issue worth addressing.
Pinpointing the Source with the Heap Allocation Profiler
Once a leak is confirmed, the heap profiler helps locate the culprit. The Profiles panel includes a Heap Allocation profiler that combines the detailed snapshot information of the standard heap profiler with the incremental tracking of the Timeline panel. During a recording, the profiler takes snapshots as frequently as every 50 milliseconds, ending with a final snapshot at the end.
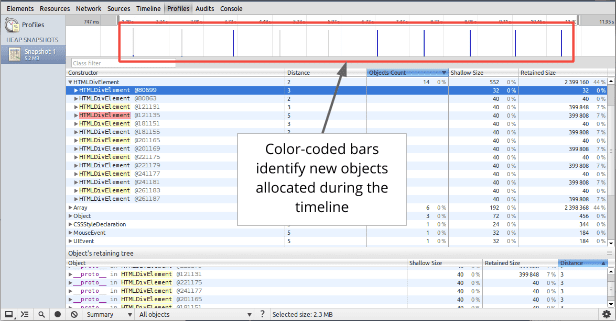
In the recording results, bars across the top indicate when new objects were allocated. The bar height corresponds to the size of the recently allocated objects. Color is the key signal: blue bars represent objects still live in the final heap snapshot, while gray bars indicate objects that were allocated and later garbage collected. An unexpected blue bar—for example, objects allocated on the first of ten identical actions—points to a potential retention problem. Zooming in on that snapshot and examining the retaining tree for a specific object reveals why it wasn't collected, allowing you to eliminate the unnecessary reference.
Fixing the Root Causes
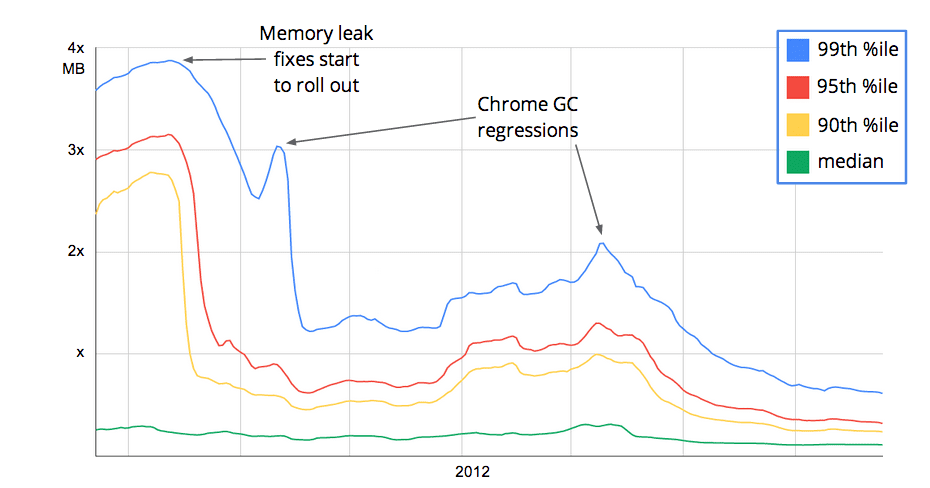
Applying these techniques, the Gmail team identified several recurring bug categories: unbounded caches, callback arrays that grew indefinitely because the awaited events never fired, and event listeners that unintentionally retained their targets. Fixing these issues produced dramatic results: users in the 99th percentile saw an 80% reduction in memory usage, while median users dropped by nearly 50%.
Lower memory usage also meant shorter garbage collection pauses, which improved overall responsiveness. As a bonus, the team's field data revealed two fragmentation bugs inside Chrome itself, detected when Gmail's metrics showed a widening gap between total allocated and live memory.
Questions to Ask About Your Own App
You can apply the same discipline to your application by asking three questions:
- How much memory is my app using? Extra caching only helps if it has a measurable performance impact. Too much memory can actually hurt responsiveness.
- Is my page leak free? Memory leaks in your page can slow down other tabs as well. Use the object tracker in DevTools to identify and fix any unintended retentions.
- How frequently is my page garbage collecting? The Timeline panel shows GC pauses. Frequent collections usually mean you're allocating too aggressively and churning through the young generation.