Kubernetes Pod Performance Deterioration Traced to Kernel Cgroup Behavior
KateSQL, Shopify's custom Database-as-a-Service platform, runs hundreds of production MySQL instances across multiple regions on Google Cloud's Kubernetes Engine (GKE). Earlier this year, KateSQL's instance replacement operations—which create new MySQL replicas before stopping old ones—revealed highly variable MySQL Pod creation times, ranging from 10 to 30 minutes. The affected Pods were otherwise identical to their faster counterparts: the same CPU, memory, storage configuration, and dataset.
The slowdown substantially impacted maintenance operations such as configuration changes and upgrades, where quick instance replacement is essential. Investigators eventually traced the problem to a Linux kernel bug in the memory cgroup controller.
Pinpointing the Delay
Pod creation time in KateSQL includes spinning up a new GKE node when needed, creating a Persistent Disk from the latest snapshot, creating the MySQL Pod, initializing the mysql-init container (which runs InnoDB crash recovery), and starting mysqld in the mysql container. Timing measurements of the mysql-init phase and MySQL startup revealed a substantial gap between fast and slow Pods.
|
KateSQL instance |
Initialization |
Startup |
|
katesql-n4sx0 |
2120 seconds |
1104 seconds |
|
katesql-jxijq |
74 seconds |
17 seconds |
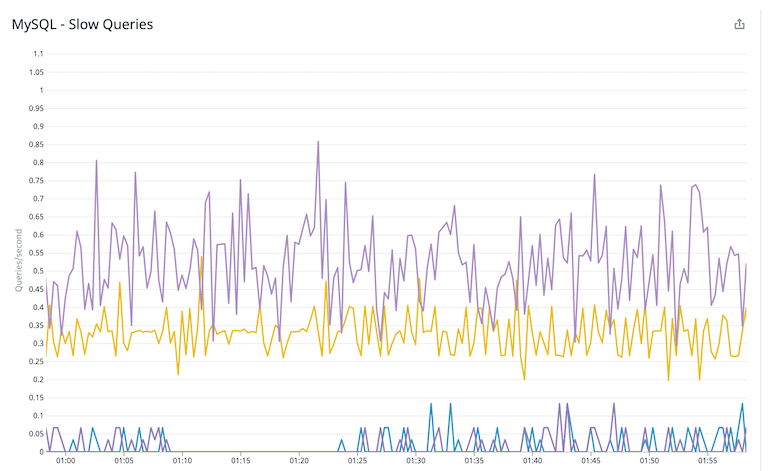
Slow Pods also demonstrated gradual performance degradation over time, evidenced by an increasing number of slow queries that relied on temporary memory tables.
First Mitigation: Node Cycling
Spot checks suggested freshly provisioned Kubernetes cluster nodes outperformed those running for several months. As an immediate remedy, the team replaced aging nodes:
- Cordon older Kubernetes cluster nodes to prevent new Pod placement.
- Use KateSQL to migrate MySQL Pods to new nodes, letting GKE autoscale by adding nodes as necessary.
- Drain cordoned nodes once migration completes, allowing the GKE autoscaler to scale the cluster down.
This procedure yielded performance improvements on new MySQL Pods.
Ruling Out Obvious Differences
A deeper analysis sought to explain why newer nodes outperformed older ones. Software versions—kubelet, the Linux kernel, Google's Container-optimized OS—were identical across nodes. The only variable was runtime.
Resource subsystem analysis ruled out storage, and the MySQL error log pointed toward memory initialization slowness. InnoDB Buffer Pool setup includes single-threaded memory allocation, verified by top showing about 100% CPU usage during the phase. strace output from a starting mysqld process showed each mmap() call taking roughly 100 ms for ~128MB allocations—extremely slow for memory allocation.

An on-CPU perf capture produced a flamegraph revealing that InnoDB's buffer pool initialization delegated to the memory allocator (jemalloc), which spent most time in the kernel function mem_cgroup_commit_charge. That function belongs to the memory control group (memcg) subsystem and charges pages from one cgroup to the allocating process's cgroup. Poor documentation for memcg complicated further analysis.
Unusual Slab Behavior
Another observation: slabtop showed abnormally high dentry cache usage—about 20GB across roughly 64 Pods on a cluster node. A blog post from Sysdig on container isolation problems offered leads, but didn't match the exact scenario. However, dropping the dentry cache manually produced immediate gains:
echo 2 > /proc/sys/vm/drop_caches
Scope-out continued: memory defragmentation wasn't a cause since /proc/buddyinfo showed sufficient higher-order free pages, and this memory remains reclaimable under pressure.
Root Cause: Cgroup Leak
Reviewing cgroup-related bug reports surfaced a command to enumerate cgroups on a system. Comparing good versus affected nodes showed roughly 50K memory cgroups on damaged nodes—far more than expected, given that some short-lived tasks may create ephemeral cgroups.
This suggested a cgroup leak. The leak explained the earlier flamegraph: cgroup commit-charge operations, which traverse many cgroups per page charge and touch the page cache LRU list, become prohibitively expensive at scale.
Several resources consolidated the hypothesis:
- A bug report unrelated to Kubernetes revealing underlying cgroup issues and the available fix.
- An LWN article describing nearly the exact scenario.
- A Kubernetes workaround for the problem.
- A Linux kernel mailing list thread.
Armed with this information, the team consulted Linux kernel engineers at Google, who confirmed they were hitting a side-effect of the documented issue: reparenting slab memory on cgroup removal.
Validation and Resolution
To prove the hypothesis, the team wrote to a control file for the kubepods cgroup—the parent cgroup for Kubernetes Pods—emptying zombie or dead cgroups:
$ echo 1 | sudo tee /sys/fs/cgroup/memory/kubepods/memory.force_empty
Memory cgroup counts plummeted to about 1,800—consistent with healthy nodes—and a quick MySQL Pod restart showed dramatic improvements: an 80G InnoDB buffer pool initialized in five seconds. The fix wasn't merely cosmetic; it resolved the root cause in the kernel's handling of memory cgroups, restoring expected performance levels for KateSQL's MySQL instances.
Remediation Options and the Chosen Fix
The team evaluated several workarounds and fixes, consulting with Google's Kernel Engineering team along the way:
- Rebooting or cordoning node VMs, identified by monitoring
/proc/cgroups output. - Scheduling a cron job to periodically drop SLAB and page caches—an older DBA/sysadmin technique that could work but risks a performance penalty on read I/O.
- Moving short-lived Pods to a dedicated node pool to isolate them from critical components like MySQL Pods.
- Running
echo 1 > /sys/fs/cgroup/memory/memory.force_emptyin apreStophook of short-lived Pods. - Upgrading to COS 85, which contains upstream fixes for cgroup SLAB re-parenting bugs. Moving from GKE 1.16 to 1.18 would deliver Linux kernel 5.4 with the necessary fixes.
Because the team was already due for a GKE version upgrade, they created new clusters on GKE 1.18 and provisioned new MySQL Pods there. After several weeks of running on the updated version, MySQL InnoDB Buffer Pool initialization times and query performance had stabilized:

This investigation stands as one of the lengthiest the Database Platform group has undertaken. The difficulty stemmed from the problem's nature: it was hard to reproduce and there was no established playbook for diagnosing it. In the end, the range of viable solutions proved to be a positive takeaway.
The team extended special thanks to Roman Gushchin from Facebook's Kernel Engineering team, reached via LinkedIn, and to Google's Kernel Engineering team for helping confirm and resolve the root cause.