Xcode build logs hide valuable performance data. XCMetrics surfaces it.
When Spotify's mobile infrastructure team adopted Swift for its flagship app, one requirement was clear: don't make life worse for developers. The most direct way to check that was to watch build times—but timing every build manually was never going to scale. Xcode does record build data internally, yet most developers never see it.
XCMetrics, now open sourced, is Spotify's answer. It's a Swift-based tool that collects, parses, stores, and visualizes build metrics from Xcode—tracking everything from typecheck times to hardware performance. After a year in production at Spotify, the system has ingested over a million builds and billions of compilation steps, producing more than 10TB of data.
What Xcode's logs actually contain
Every time xcodebuild runs—locally or in CI—it produces an xcactivitylog file. Most developers never open that file, but it contains more than just build output: warnings, errors, and timing data from every step of the build.
Spotify previously released XCLogParser to make that data readable. The parser worked, but teams still had to build their own infrastructure to continuously collect logs and maintain them. What was missing was a turnkey system—something that could integrate into a distributed, production environment and provide trend analysis over time. XCMetrics fills that gap.
What XCMetrics can answer
The tool's value shows up in the questions it lets teams ask about their codebase. At Spotify, that includes queries like:
Which function takes the longest to typecheck each day?
Which pull request introduced a specific warning or compilation failure?
What hardware and software configurations produce the fastest build times for engineers?
Answers like these inform decisions about project structure, tooling investments, and machine provisioning.
How the system fits together
XCMetrics splits into a few distinct components:
CLI tool: A Swift executable invoked from a post-scheme action after each build. Its job is to cache and upload build metrics.
Backend service: Also written in Swift, receives the log and attaches metadata through a multipart request. Parsing and storage can run synchronously, or asynchronously for scale.
PostgreSQL database: Parsed data lands here, partitioned by day for efficient historical queries.
For asynchronous processing, logs are queued in a Redis instance.
Built for customization
XCMetrics ships with sensible default metrics, but teams can extend it by wrapping the Swift Package and invoking it manually. This allows custom data to be attached to every build. Examples Spotify suggests include:
Anonymized version control state, to correlate build times with dirty checkouts
Thermal throttling conditions that might slow a machine
Project configuration details that influence build behavior
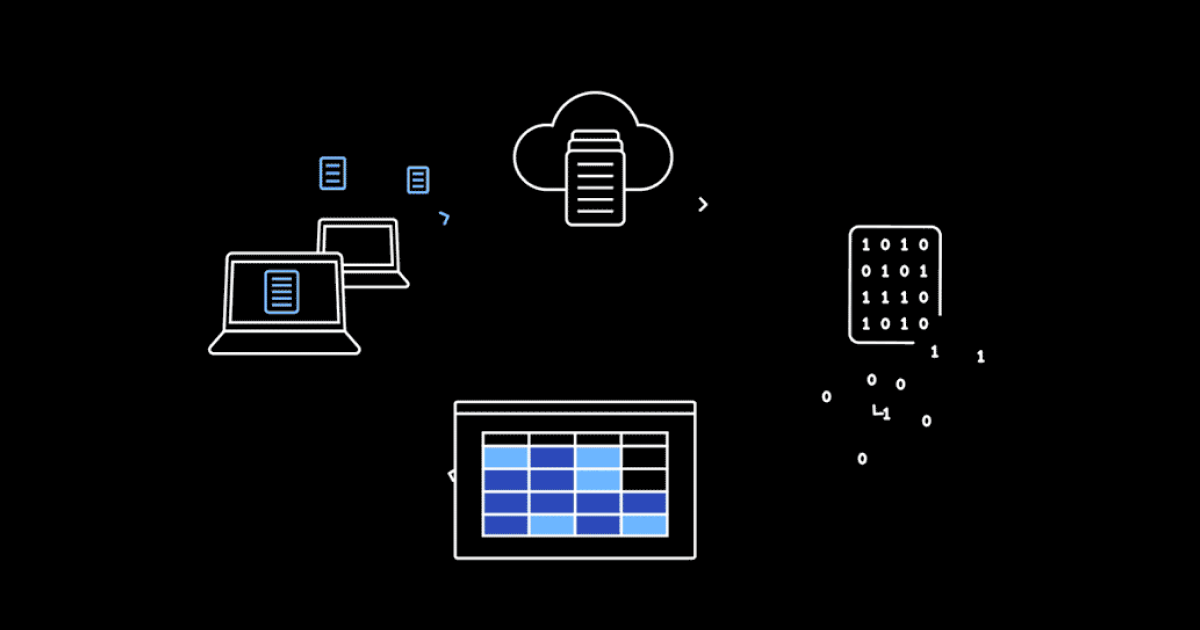
Plugins receive a dictionary of environment variables passed from the post-scheme action and return a dictionary of metrics to collect. Teams distribute their own customized XCMetrics binary with the same invocation arguments.
Deployment is not the hard part
The backend runs from a Docker image that can be deployed to any infrastructure. Spotify also supports one-click deployment to Google Cloud Run and provides examples for Kubernetes. No dedicated DevOps team is required.
The project has been running in production at Spotify for over a year, with dashboards monitoring the health of the codebase and toolchain daily. Outside teams can find the full documentation and a demo at XCMetrics.io, with the code and contribution guide on GitHub.